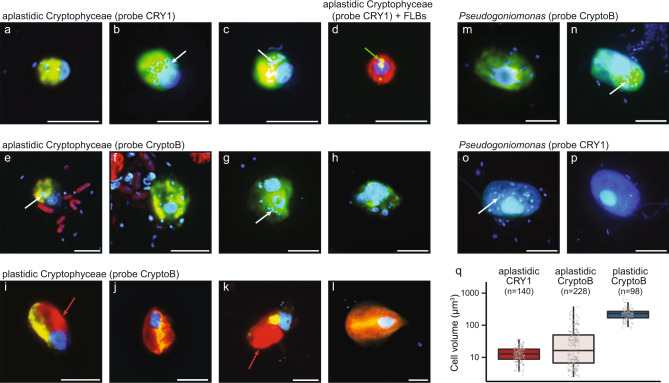
Fig. 1. Morphological diversity of cryptophytes and comparative cell volume estimations.
Microphotographs showing typical flagellate morphologies and sizes of the cells targeted by two eukaryotic FISH probes, Cry1-652 (a–d) and CryptoB (e–p), with ingested DAPI-stained bacterial prey (a–c, e–h, m–p) or FLB (d) in food vacuoles. Examples are shown from the studied lakes (a–l) or a cultured Pseudogoniomonas strain (m–p) isolated from Římov reservoir. Shown are overlay Z-stack images of flagellates targeted by the FISH probes (fluorescein-stained flagellates (yellow) in a–c, e–p, or an Alexa546-stained flagellate ([red] in d) and DAPI-stained protistan nuclei ([blue] in a–p), DTAF-labeled ingested FLB ([yellow] in d) and chloroplast-bearing autotrophic cells of Rhodomonas and Cryptomonas spp. with bright orange-red chloroplasts in cells (i–l). A cultured representative of the aplastidic non-CRY1 cryptophyte Pseudogoniomonas sp. (m–p), targeted by probe CryptoB (m, n) with a “negative control” of no hybridization signal with probe Cry1-652 (o, p). White arrows highlight examples of typical positions of ingested bacteria, a green arrow of ingested FLBs (d) in the grazer food vacuoles and red arrows positions of chloroplasts (I, k) in chloroplast-bearing cryptophyte cells. The Z-stack images of protistan cells were acquired with the protocol detailed in Šimek et al. [34, 41]. The scale bar shows a length of 5 μm. Boxplots presenting median and 25th and 75th percentiles of cell volume distributions (q) of aplastidic CRY1, aplastidic flagellates targeted by probe CryptoB, and plastidic flagellates targeted by probe CryptoB. Values are based on epilimnetic samples of four lakes where they co-occurred (for details see Supplementary Table S2).

