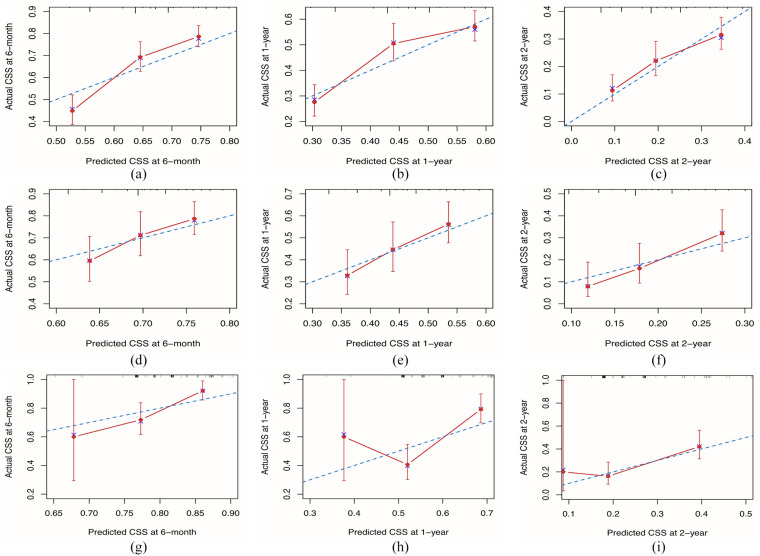
Figure 4.
Calibration of the nomogram at 6 months, 1 year, and 2 years in the training, internal validation, and external validation cohorts. The nomogram-predicted CSS is plotted on the x-axis and the actual CSS is plotted on the y-axis. The 45° line indicates a perfect prediction model. The 6-month, 1-year, and 2-year CSS rates of the (A to C) training, (D to F) internal validation, and (G to I) external validation cohorts. CSS, cancer-specific survival.

