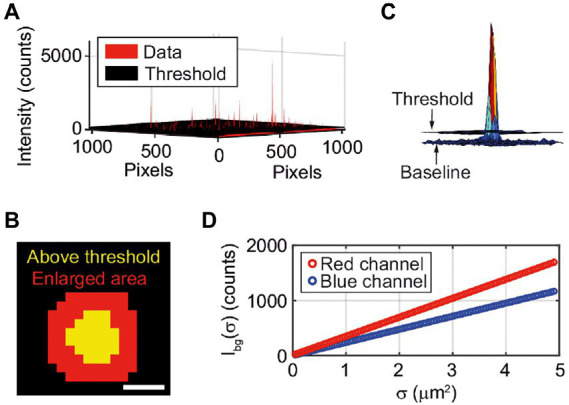
Figure 2.

(A) Vesicles are detected using a 2-dimensional threshold (Eq. 2) matrix based on a user-determined SFR (here SFR = 2). All red peaks above the black threshold “floor” are detected vesicles. Note that since the vesicles are smaller than the diffraction limit of light the measured spot size in the fluorescence microscopy images does not correspond to their actual size. (B) The area that is detected as a pixel is enlarged by a 5 × 5 matrix. The scale bar is 1 μm. (C) Intensity from a single vesicle, threshold and baseline. (D) The background intensity (IBG) dependence on the spot size (σ) for the blue and red channel.
