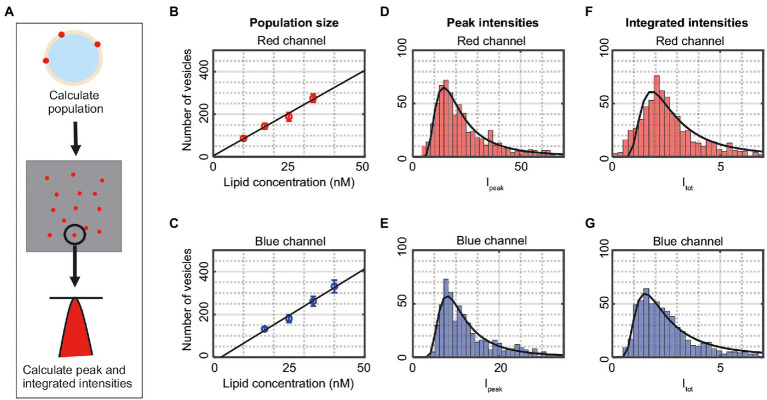
Figure 4.
(A) Illustration of the detection process. The vesicles are shown as spots in the two-dimensional image. The number of vesicles is counted, and the peak intensity (Ipeak) as well as the integrated intensity (Itot) of the individual vesicles are calculated. (B,C) The number of detected vesicles in the channels as a function of added lipid concentration. The data correspond to mean ± SD from n = 3–5 measurements. The solid lines are linear fits to the data. (D,E) Peak intensities, Ipeak (Eq. 5), of vesicles in the red and blue channel from one representative measurement. The solid lines are fits to a Weibull distribution. (F,G) Integrated intensities, Itot (Eq. 4), of vesicles in the red and blue channel from one representative measurement. The solid lines are fits to a Weibull distribution.

