Figure 5.
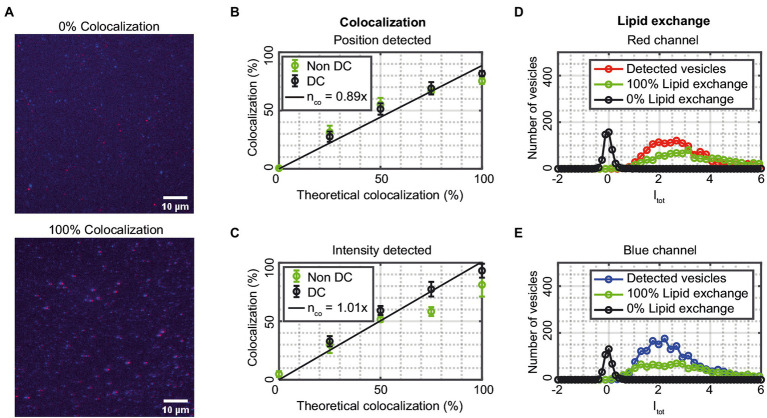
(A) Fluorescence images of two samples of vesicles, either all vesicles are blue or red (0% colocalization) or all vesicles are both blue and red (100% colocalization). The red and blue channels are merged, and the scale bars are 10 μm. (B,C) The measured colocalization as a function of theoretical colocalization for data that is not drift corrected (green) and data that is drift corrected (black). The data corresponds to mean ± SD from n = 3–5 measurements. The solid lines are linear fits to the drift corrected data. (D,E) The integrated intensity Itot (Eq. 4) distribution for the vesicle population collected from 1 to 3 measurements. Detected vesicles correspond to vesicles that are detected in the red (blue) channel and 0 and 100% lipid exchange refers to values when the mask from the blue (red) channel is applied to the red (blue) channel for samples with 0 and 100% lipid exchange.

