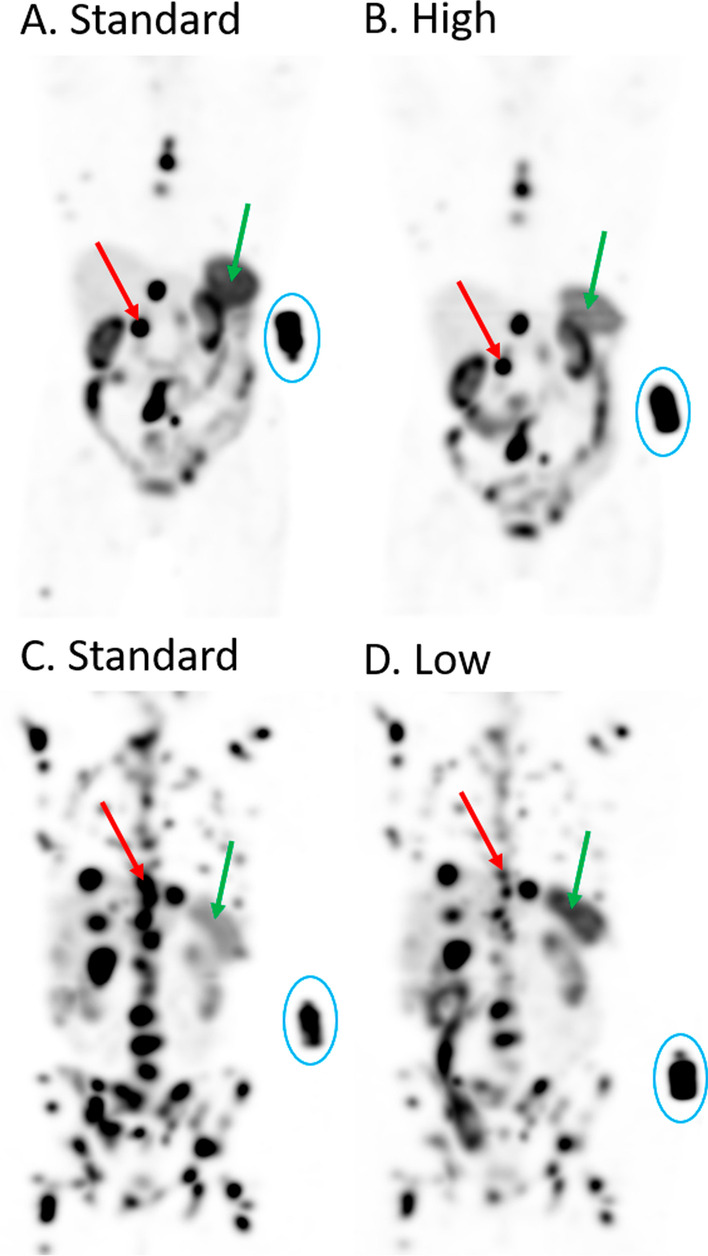
Fig. 3.

Maximum intensity projections of SPECT images acquired 24 h after injection of [177Lu]Lu-HA-DOTATATE. (A, B) Patient with both standard (cycle 2) and high (cycle 1) peptide amount. (C, D) Patient with both standard (cycle 1) and low (cycle 2) peptide amount. Green arrows indicate the spleen, which shows decreased uptake with high peptide amount and increased uptake with low peptide amount. Red arrows point to tumor lesions, which show decreased uptake in both high and low peptide amounts. A reference standard with known amount of radioactivity is scanned with each patient (encircled in blue)
