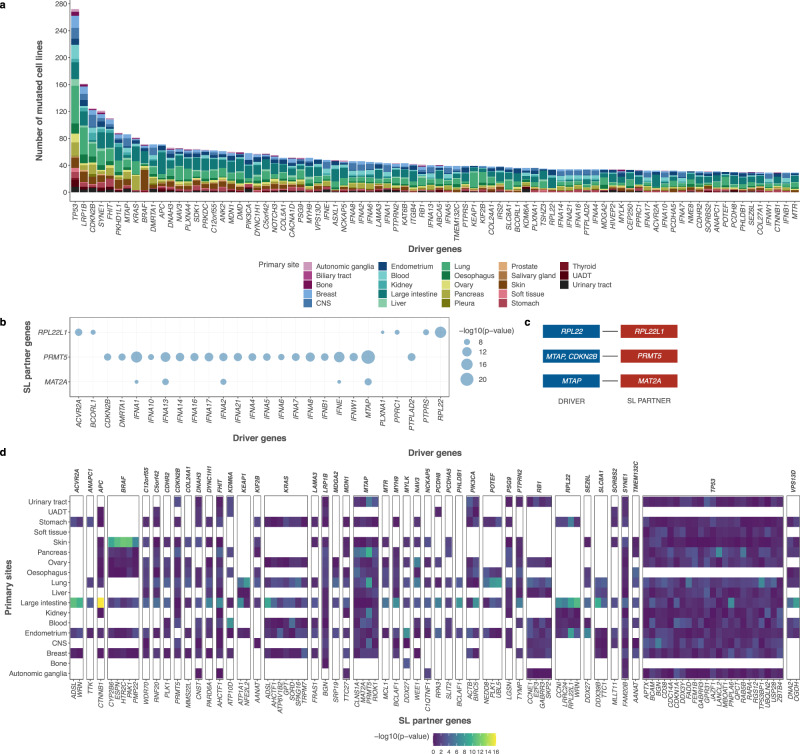
Fig. 2. Pan-cancer SLIdR predictions.
a Stacked barplot indicating the frequencies of 84 mutated driver genes across different cancer types. The number of mutated cell lines of a given cancer type may have an impact on the statistical power of the SLIdR framework. b Bubble-plot summarizing the significance (-log10(p-value)) of different driver genes (x-axis) pairing with the same SL partner gene (y-axis) as predicted by SLIdR in the pan-cancer analysis after filtering out false positives from multiple testing. The p-values are computed using one-sided IH-test. c Corresponding list of significant SL pairs after accounting for confounding mutations and performing causal inference using matching-based potential outcome models. d Differential sensitivities of pan-cancer SL pairs in subsets of cell lines grouped by primary sites (y-axis). Each panel corresponds to a specific driver gene (x-axis top) and encapsulates the significance profiles of all its SL-partners (x-axis bottom) across various primary sites. Each column in a given panel depicts the significance profile of the SL pair in subsets of cell lines grouped by primary sites. The p-values are computed using one-sided IH-test.

