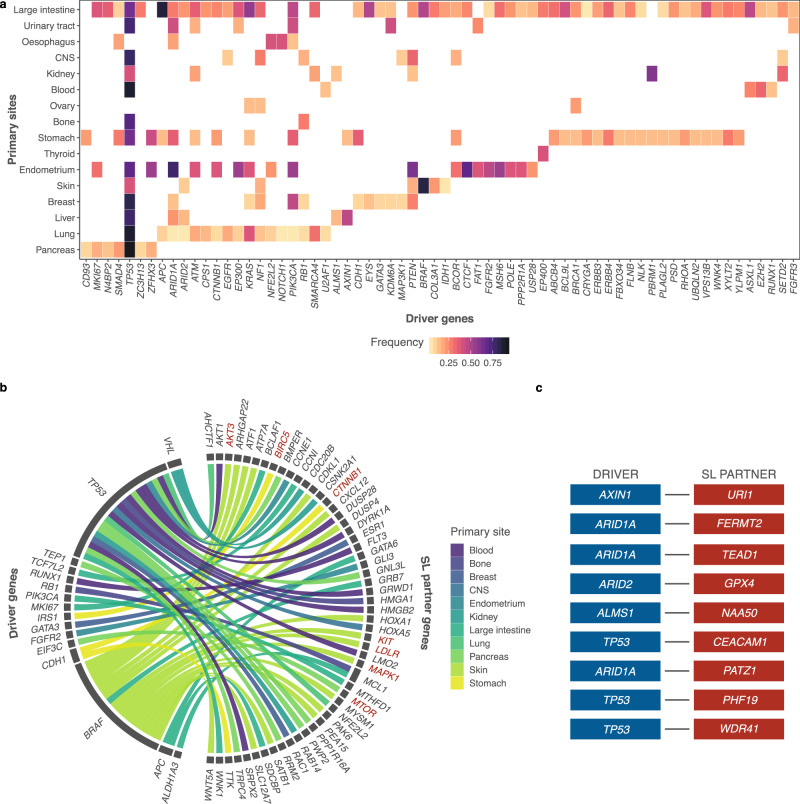
Fig. 3. Cancer type-specific SLIdR predictions.
a Heatmap of frequencies of 66 driver genes across 16 cancer types. b Circos plot summarizing the SL partners (right) of different driver genes (left) with literature evidence, across 11 cancer types. The SL pairs constituting SL partners in red have further evidence in the PRISM drug response screen (significance level α = 0.1). c Top-ranked SL pairs in hepatocellular carcinoma reported by SLIdR.

