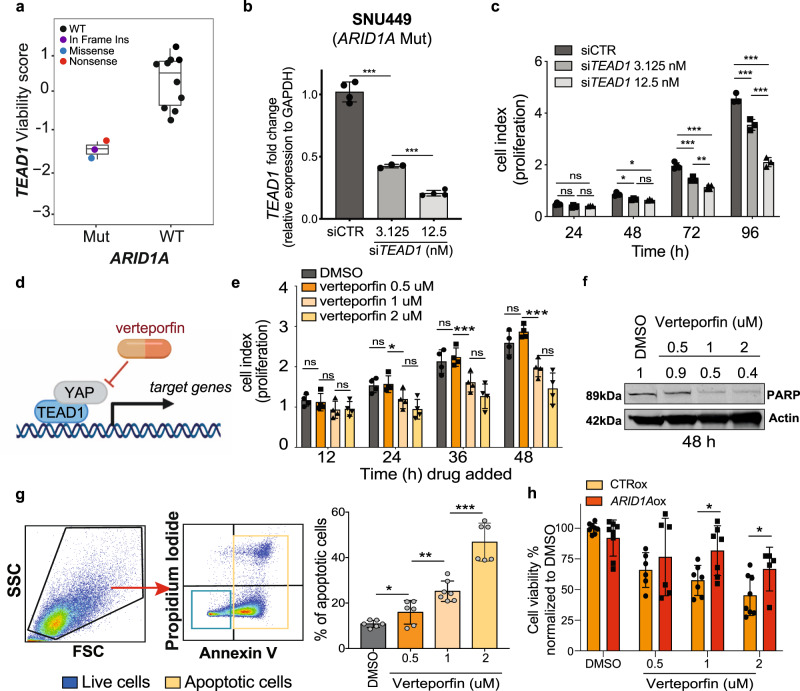
Fig. 4. Inhibition of TEAD1 is deleterious in ARID1A mutant liver cancer cells.
a Viability scores of ARID1A mutant vs wild-type (WT) HCC cell lines with TEAD1 knockdown from Project DRIVE dataset, where n = 13 HCC cell lines subject to TEAD1 knockdown experiment. Data are presented as boxplots: Mutant = {min = −1.666, lower (1st Qu.) = −1.5375, middle (median) = −1.409, upper (3rd Qu.) = −1.3190, max = −1.229} and WT = {min = −0.722, lower (1st Qu.) = −0.3455, middle (median) = 0.442, upper (3rd Qu.) = 0.7295, max = 1.044}. b RNA expression level (fold-change) of TEAD1 relative to GAPDH in SNU449 cells transfected with control siRNA or with different concentrations (3.125 and 12.5 nM) of TEAD1 siRNA. RNA levels were assessed by quantitative real-time PCR (qPCR). c Proliferation kinetic of SNU449 cells (ARID1A mutated) transfected with control siRNA or with different concentrations (3.125 and 12.5 nM) of TEAD1 siRNA. d Schematic representation of verteporfin mechanism of action. e, f, g Proliferation kinetic (e), immunoblot for PARP (f), and apoptosis assay using AnnexinV and propidium iodide (PI) staining (g) of SNU449 cells treated with vehicle (DMSO) or different dosage of verteporfin. f Protein lysates of SNU449 cells 48 h post-treatment with DMSO or different dosage of verteporfin up to 48 h. h SNU449 cells overexpressing ARID1A and control cells treated with vehicle (DMSO) or different dosage of verteporfin. Error bars represent mean (+/−SD) from n ≥ 2 replicated. For all experiments performed, statistical significance was assessed by two-sided multiple t-tests (*P < 0.05, **P < 0.01, ***P < 0.001). d was generated using BioRender.

