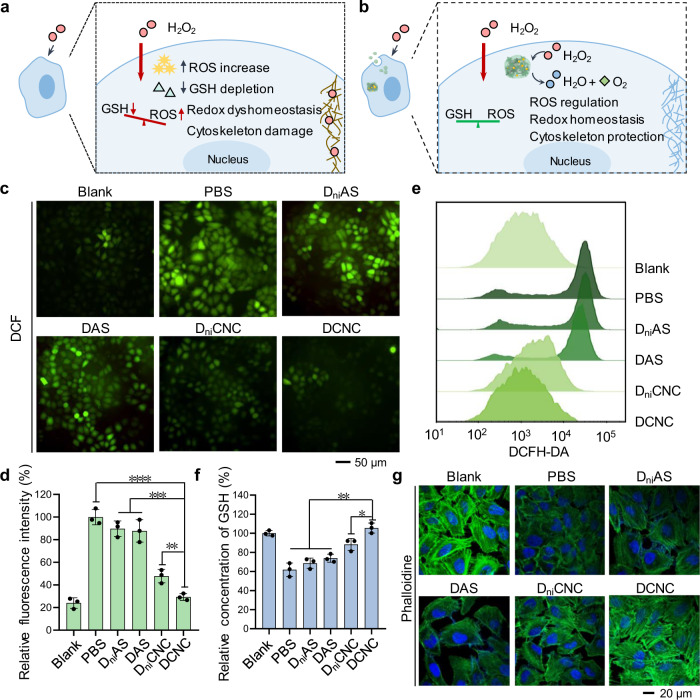
Fig. 5. ROS regulation effects of DCNC in living cells.
a Schematic illustration of cell effects upon the treatment of high-concentration H2O2. b Schematic illustration cell effects upon the treatment of DCNC and then high-concentration H2O2. c Representative fluorescence microscopy images showing ROS levels measured with DCF fluorescent probe after incubation with different materials and treatment with H2O2. d Mean fluorescence intensity of DCF analyzed by image J software. Bars represent mean ± SD (n = 3 independent samples). (**P < 0.01; ***P < 0.001; ****P < 0.0001, calculated by two-tailed unpaired t test). e Flow cytometry of ROS levels in the MCF-7 cells treated with a DCFH-DA fluorescent probe after incubation with different materials and H2O2. f Relative concentration of intracellular GSH in the MCF-7 cells treated with different materials and H2O2. Bars represent mean ± SD (n = 3 independent samples). (*P < 0.05; **P < 0.01, calculated by two-tailed unpaired t test). g Representative confocal microscopy images of F-actin stained with FITC-phalloidine after incubation with different materials and treatment with H2O2.

