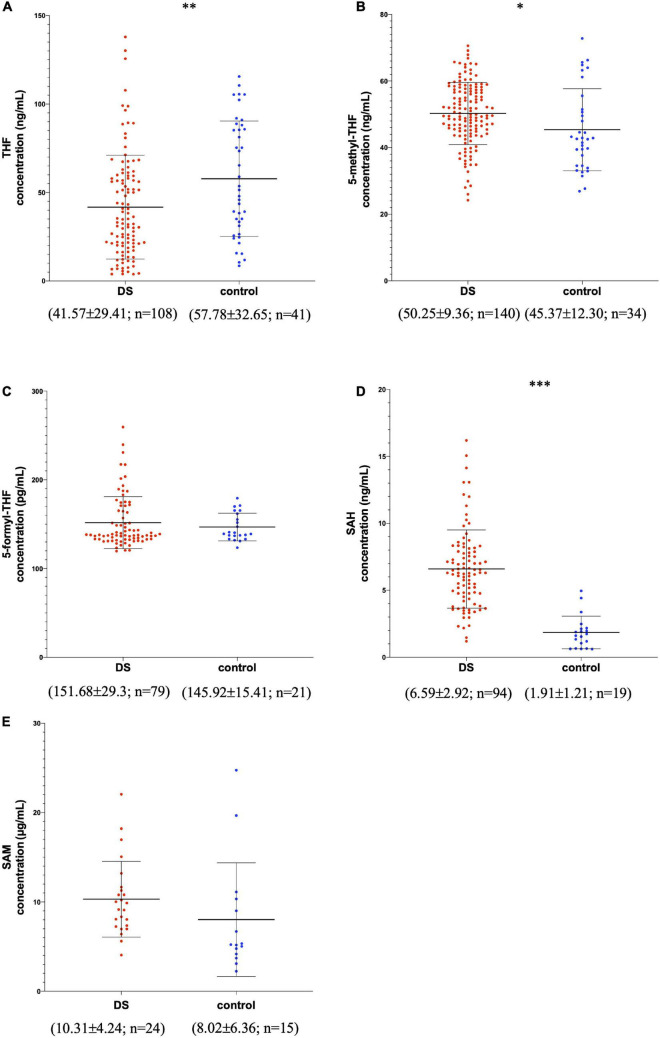
FIGURE 2.
Metabolite concentrations in subjects with DS and normal control subjects. The graphs report metabolite plasma levels of each subject in the study. On the x-axis there is the subdivision of subjects in DS and control groups. Subjects with DS are represented like red dots and normal control subjects are represented like blue dots. On the y-axis the concentration of the metabolite in μg/ml, ng/ml or pg/ml is reported. The asterisks above the graph indicate the level of statistical significance (*p < 0.05; **p < 0.005; ***p < 0.0005). The middle black lines indicate the mean concentration values for each group and the external black lines indicate standard deviation (SD) values. The mean concentration, SD values and the number of subjects (n) are reported below each graph for DS and control groups. (A) shows THF concentrations; (B) shows 5-methyl-THF concentrations; (C) shows 5-formyl-THF concentrations excluding strong outliers; (D) shows SAH concentrations excluding strong outliers; (E) shows SAM concentrations. The graphs were created with GraphPad Prism software v.6.0 (San Diego, CA).

