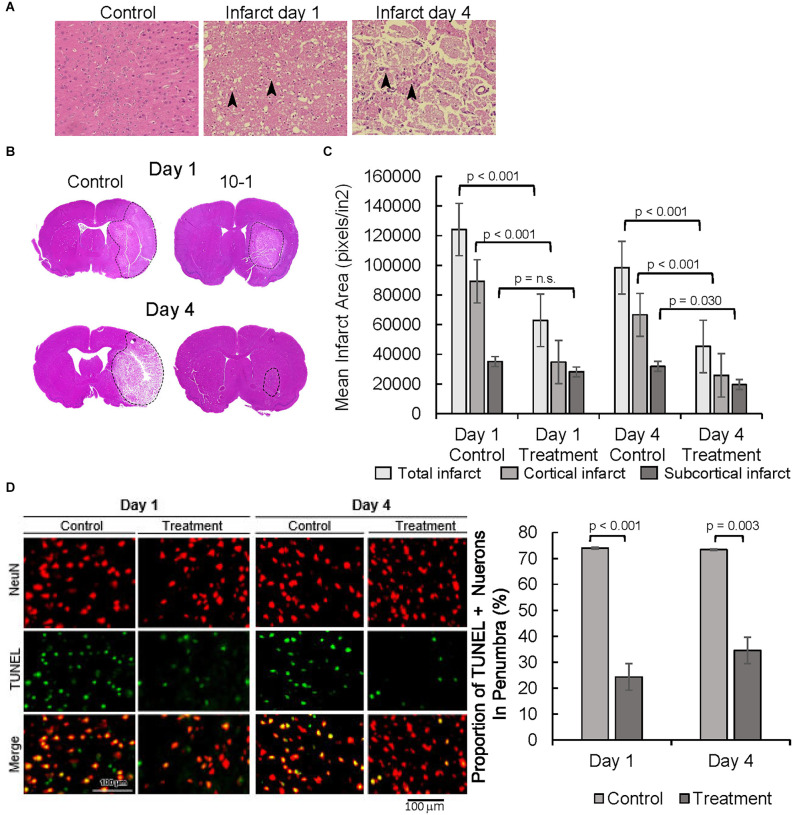
Figure 2.
10-1 treatment attenuates progression of tissue damage post-MCAO R. (A) H&E tissue sections from the contralateral side (control, 1 day post-MCAO) and infarct areas at day 1 and day 4. Arrows indicate areas containing darkly stained pyknotic nuclei, cell body shrinkage, perineuronal vacuolization, and granular necrotic debris. (B) Representative H and E sections day 1 and day 4 post-MCAO. (C) Cortical and sub-cortical infarct size were measured in H&E stained brain tissue sections 1 day and 4 days post-MCAO R. (D) Representative images of TUNEL and NeuN immunostaining showing neuronal apoptosis one and 4 days post-MCAO R. Quantification of TUNEL positive NeuN positive cells. Day 1 and day 4 n = 10 control, 10 drug-treated, three images per section.

