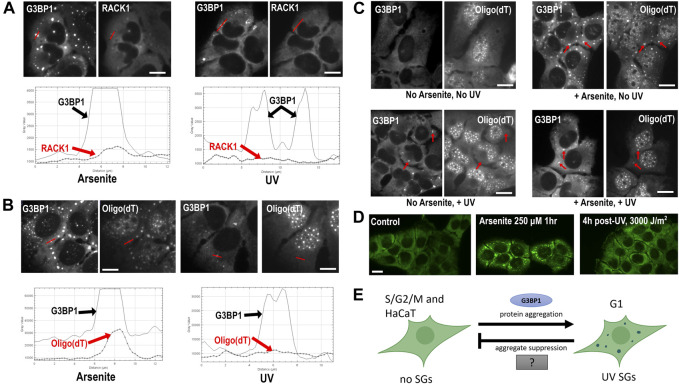
FIGURE 1.
Composition and formation of UV SGs. (A) RACK1 does not localize to UV-induced SGs. U2OS treated with arsenite (500 μM, left panels) or UV (15 J/m2, then assayed at 4 h post-UV, right panels) and co-stained with antibodies to G3BP1 and RACK1. Profile intensity plots over the red line from each image were compiled using ImageJ. (B) U2OS treated with arsenite (500 μM, left panels) or UV (15 J/m2, then assayed at 4 h post-UV, right panels) and co-stained with antibodies to G3BP1 and Oligo (dT). Profile intensity plots over the red line from each image were compiled using ImageJ. (C) Poly(A)+ RNA SGs can form after UV treatment. U2OS were untreated or treated with UV (15 J/m2) for 3 h, then arsenite (500 µM) was added where indicated for a 1 h, then cells were fixed and co-stained with antibodies to G3BP1 and Oligo (dT) FISH. Red arrows point to prominent SGs in each treatment condition. (D) HaCaT cells do not form UV SGs. HaCaT cells were exposed to arsenite 250 µM for 1 h, or exposed to 3,000 J/m2 UV (4 h post-exposure), then stained with antibody for G3BP1 to assess SG formation. Detailed methods for all panels are available as Supplementary Material online. (E) A model for UV SG suppression. See Discussion section for details.

