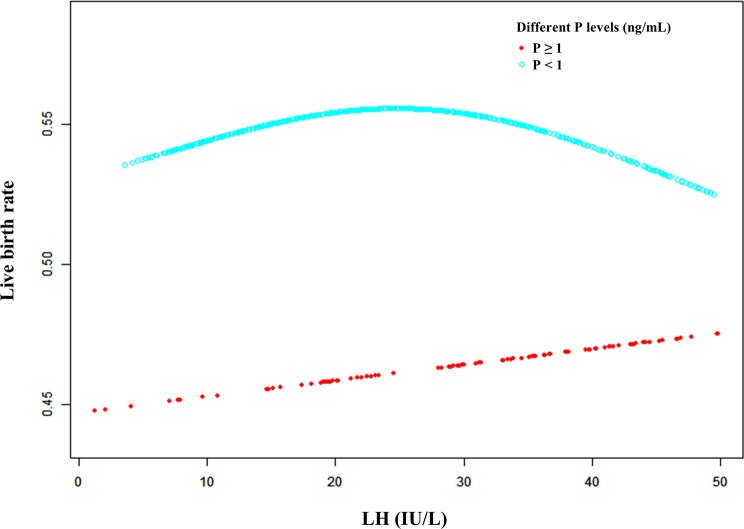
Figure 3.
A smooth fitting curve analysis of the relationship between LH levels on the hCG day and the live birth rates of patients with different P levels. The live birth rate decreased as the LH level on the hCG day gradually increased when the P level was equal to or greater than 1 ng/mL. In addition, the live birth rate of the patients with a lower P level (less than 1 ng/mL) on the hCG day decreased as the LH level gradually increased when the LH level was beyond a certain value.

