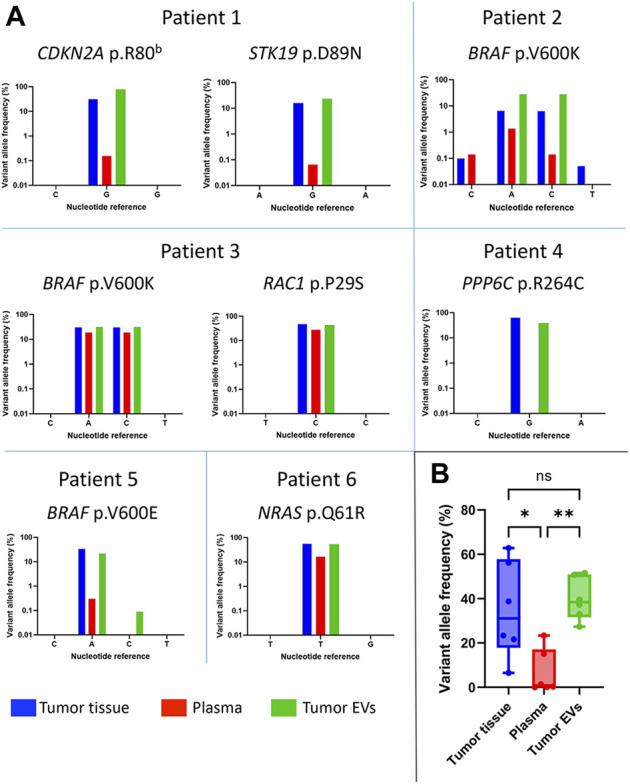
FIGURE 3.

Mutant allele frequencies in melanoma patients. (A) Frequencies of the mutated alleles detected in tumor tissue (blue), plasma (red), and tumor-derived EVs (green) are shown per patient (B) Visualization of the median frequency of mutated tumor alleles detected in all patients (n = 6) per sample type. The allele frequency variations were considered significant with a p-value < 0.05 (*p < 0.05; **p < 0.005). Graphs are shown in logarithmic scale.
