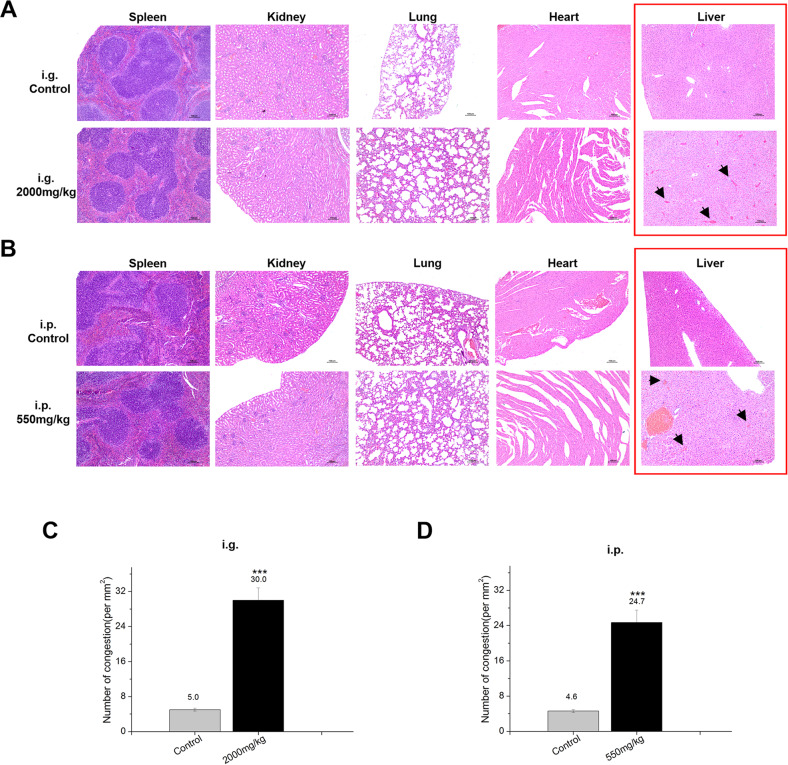
Fig. 6. Histopathological examination after I3C administration.
A Spleen, kidney, lung and heart did not show gross pathological change after I3C i.g. administration at 2000 mg/kg. Only in the liver (red square), we observed congestion areas connected to the blood stasis zone. B Spleen, kidney, lung and heart showed no gross pathological change after I3C i.p. administration at 550 mg/kg. We only observed congestion areas in the liver (red square) connected to the blood stasis zone. Congestion was stained with H&E, Black arrows indicate congestion and containing red blood cells. C The number of congestions containing red blood cells in each section after I3C i.g. administration was counted. Results are presented as the average number of congestions per mm2 as mean ± SD (n = 25–30 fields) from three biological replicates and two different observers. D The number of congestions containing red blood cells in each section after I3C i.p. administration was counted. Results are presented as the average number of congestions per mm2 as mean ± SD (n = 25–30 fields) from three biological replicates and two different observers. Statistical significance was determined by one-way analysis of variance, ***p < 0.001.

