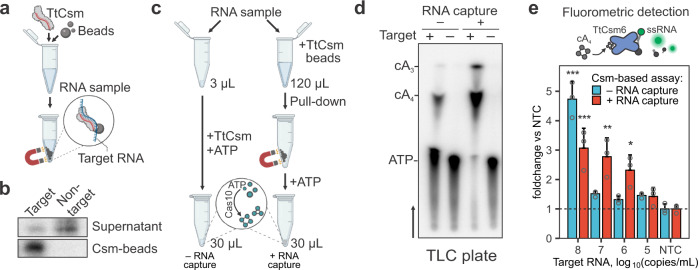
Fig. 1. Type III CRISPR-based RNA concentration enhances sequence-specific detection of RNA.
a Schematic of type III CRISPR-based RNA concentration. RNase-dead type III CRISPR complex from Thermus thermophilus (e.g., TtCsmCsm3-D34A) is added to a sample to bind complementary “Target RNA”. The His-tagged complex is concentrated using nickel-derivatized magnetic beads and a magnet. b Sequence-specific RNA enrichment with TtCsmCsm3-D34A was tested using 25 nM 32P 5‘-end labeled RNA. Target or non-target RNA fragments were mixed with His-tagged TtCsmCsm3-D34A complex (125 nM) and concentrated with nickel-derivatized magnetic beads. Phenol-chloroform extracted RNAs from the supernatants and Csm-beads were resolved using UREA-PAGE. c Csm-based direct RNA detection using 3 μL of sample is compared to an assay where TtCsmCsm3-D34 is used to capture RNA at the same concentration from a 120 μL volume. Magnetic beads decorated with TtCsmCsm3-D34A are added to the sample. After concentrating beads with a magnet, the supernatant is decanted, and he pellet is resuspended in a reaction buffer with ATP to activate polymerase activity of Cas10. Polymerization products (e.g., cA3 and cA4) are used for the downstream assays. d TtCsmCsm3-D34A polymerization reactions were performed with α-32P-ATP as shown in (c) and products were resolved using thin-layer chromatography (TLC). Black arrow shows migration of solvent in the TLC plate. Bands were annotated using chemically synthesized standards (Supplementary Fig. 1d). 3 µL (−RNA capture) or 120 µL (+RNA capture) of SARS-CoV-2 N-gene RNA (1010 copies/µL) diluted in total RNA of 293T cells were used for reactions. e TtCsm6-based fluorescent readout (top panel) is used for detection of cA4 generated by TtCsmCsm3-D34A with (red bars) or without RNA capture step (blue bars) as shown in panel (c). SARS-CoV-2 N-gene RNA diluted in total RNA of 293T cells was used as a target. Fluorescence was measured with qPCR instrument and normalized to the no target control (NTC, 293T RNA only, dashed line). In each assay, the mean (n = 3) fluorescent signal was compared with one-way ANOVA. Pairwise comparisons with NTC were performed using post hoc Dunnett’s test. Data are shown as mean ± SD. ∗p < 0.05; **p < 0.01; ***p < 0.001. Source data are provided as a Source Data file.

