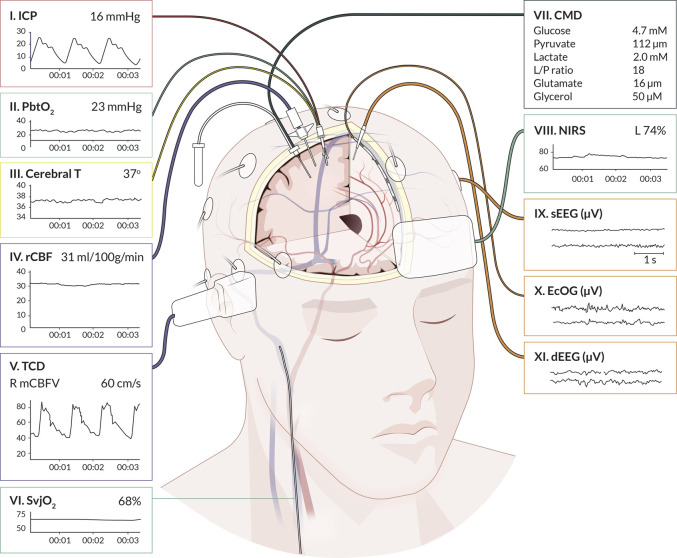
FIGURE 1.
Graphical representation of cerebral multimodality monitoring modalities. The eleven applied monitoring modalities with numbers and (raw) signals. Each modality presents the standard visualization on the bedside monitoring screen. For the readability of the figure, only two neuronal activity monitoring electrodes are displayed. In common practice, the numbers for sEEG are application of 21 electrodes, for ECoG and dEEG 4-8 electrodes. Cerebral T, cerebral temperature; CMD, cerebral microdialysis; dEEG, depth electroencephalography; ECoG, electrocorticography; ICP, intracranial pressure; NIRS, near-infrared spectroscopy; PbtO2, partial pressure of brain tissue oxygenation; rCBF, regional cerebral blood flow; sEEG, surface electroencephalography; SvjO2, jugular bulb venous oximetry; TCD, transcranial Doppler. Professional illustration by Anna Sieben (Sieben Medical Art).

