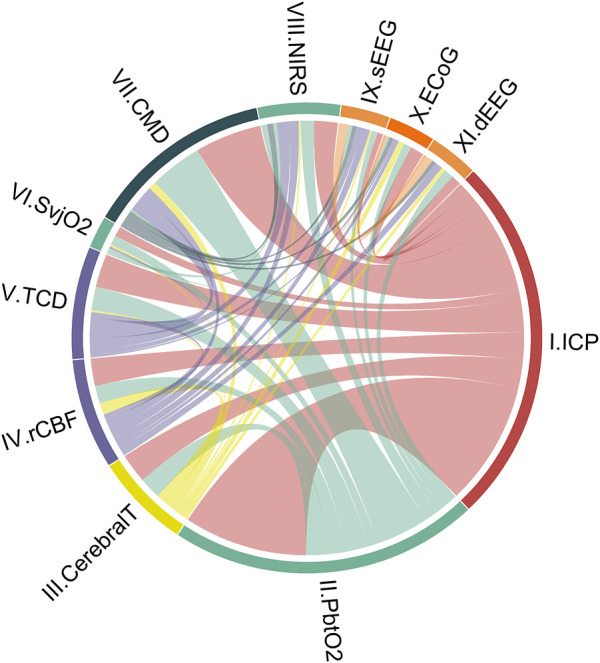
FIGURE 2.

Combinations of cerebral unimodal monitoring modalities in the literature over the last 7 years (112 studies). Circos-plot visualizing connections between unimodal continuous cerebral monitoring modalities. ICP monitoring is the modality most combined, followed by PbtO2. As an illustration to understand the distribution of each part: ICP monitoring appears in study 1 in combination with modalities II and III, and in study 2, ICP appears with modalities IV and V. ICP monitoring is then displayed on 2/6 of the circle (ICP + ICP + II + III + IV + V, 6 of which 2x ICP). The colors represent intracranial volume (red), cerebral oxygenation (green), regional cerebral blood flow (purple), cerebral metabolism (dark blue), neuronal electrical activity (orange), and cerebral temperature (yellow). Cerebral T, cerebral temperature; CMD, cerebral microdialysis; dEEG, depth electroencephalography; ECoG, electrocorticography; ICP, intracranial pressure; NIRS, near-infrared spectroscopy; PbtO2, partial pressure of brain tissue oxygenation; rCBF, regional cerebral blood flow; sEEG, surface electroencephalography; SvjO2, jugular bulb venous oximetry; TCD, transcranial Doppler.
