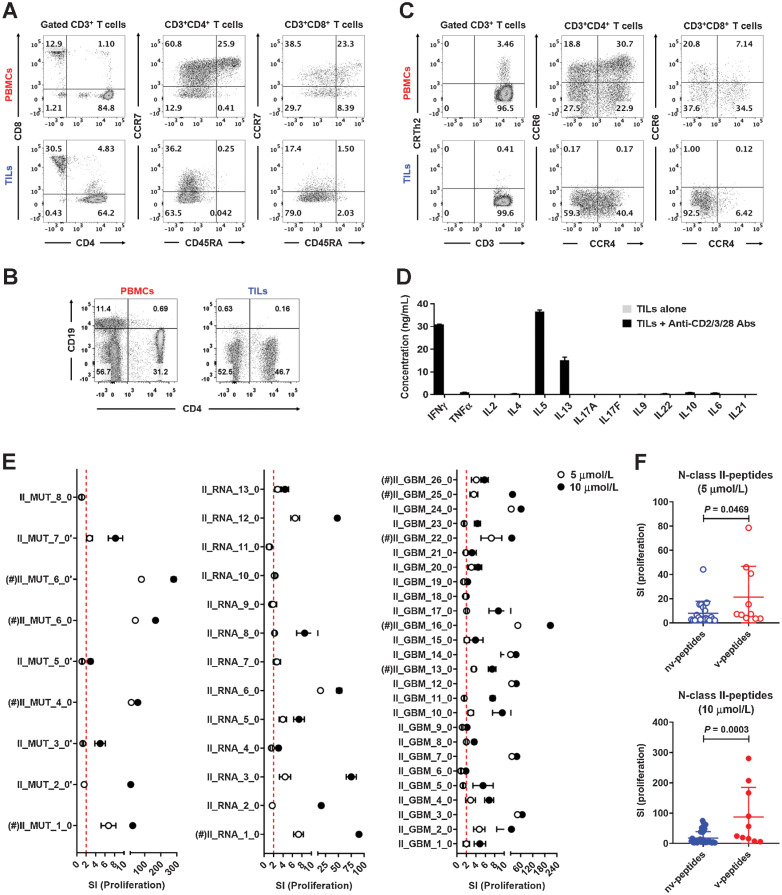
Figure 3.
TILs display a Th1/Th2-mixed phenotype and respond strongly to N-class II-peptides. A, Phenotypes and frequencies of naïve and memory CD4+ and CD8+ T-cell subsets in PBMCs and TILs, which were collected after the fourth peptide cocktail vaccination, were detected by FACS. B, Frequencies of CD19+ B cells in PBMCs and TILs were detected by FACS. C, Functional phenotypes of naïve and memory CD4+ and CD8+ T cells in PBMCs and TILs were detected by FACS. D, TILs were stimulated with anti-CD2/CD3/CD28 beads for 5 days, and cytokines in the supernatants measured with a bead-based immunoassay (LEGENDplex multianalyte flow assay kit). E, TILs were stimulated with 5 or 10
 N-class II-peptides for 5 days, and proliferation was measured by 3H-thymidine incorporation assay. Five replicate wells were tested for proliferation, and responses were depicted as SI. The red dotted line indicates a stimulatory response of SI = 2, and values above the red dotted line were considered positive. F, Comparison of the proliferation levels of TILs after stimulation with positive nv- and v-N-class II-peptides at the concentrations of 5 or 10 μmol/L. Five replicate wells were tested for proliferation. (#) indicates the peptide that was used in the first to fourth vaccinations. Data are expressed as mean ± SEM, and P values were determined using an unpaired t test.

