Fig. 2.
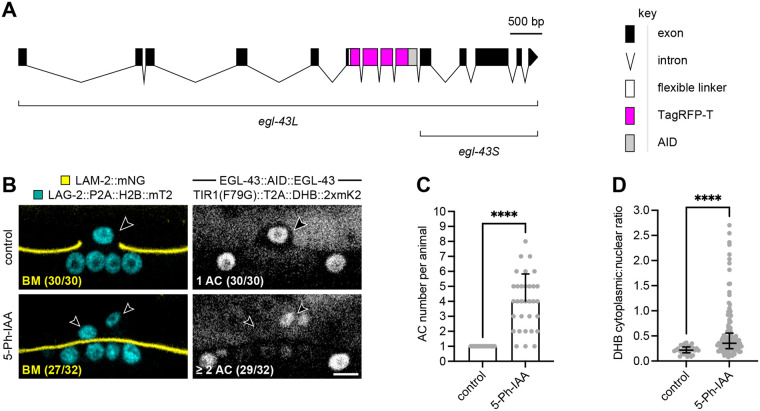
Robust degradation of EGL-43 produces the expected AC phenotypes. (A) A schematic of the endogenously tagged AID allele of egl-43. This allele is hereafter referred to as EGL-43::AID::EGL-43, because TagRFP-T is undetectable above background levels of fluorescence. (B) Micrographs of L3 larvae at the time of AC invasion expressing LAG-2::P2A::H2B::mTurquoise2 and LAM-2::mNeonGreen (left) as well as TIR1(F79G)::T2A::DHB::2xmKate2 and EGL-43::AID::EGL-43 (right) in the absence (top) and presence (bottom) of 5-Ph-IAA. Treatments were initiated at the L1 larval stage prior to AC specification, leading to defects in AC specification and AC invasion. Scale bar: 5 μm. (C) Number of ACs per animal following 5-Ph-IAA treatment. Data presented as the mean with SD (N≥30 animals per treatment). P<0.0001 as calculated by the Welch's t-test. (D) Cytoplasmic-to-nuclear ratios of DHB::2xmKate2 following 5-Ph-IAA treatment. Data presented as the median with interquartile range (N≥30 animals per treatment). P<0.0001 as calculated by the Mann–Whitney test.

