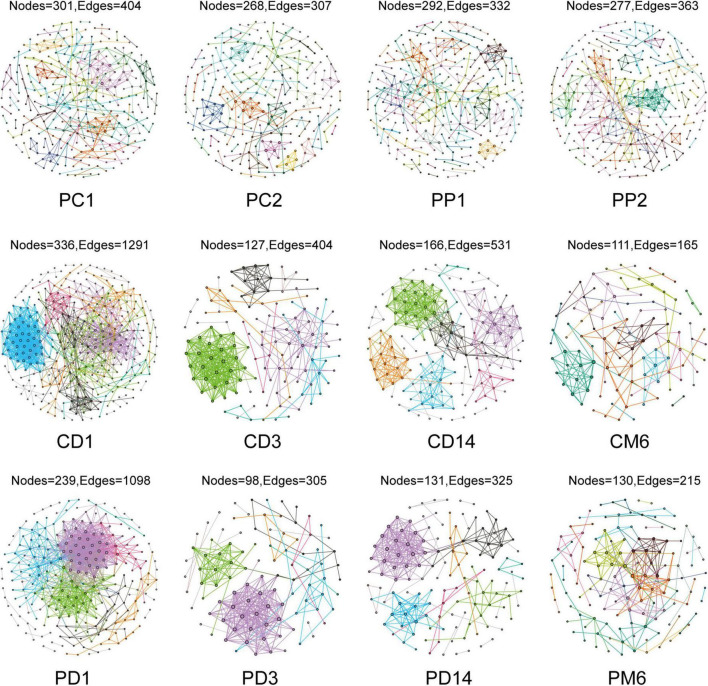
FIGURE 2.
Overview of the networks in pregnant women and infants. Each node represents one OTU, edges indicate significant correlations between OTUs. Different color represents different modules. PC1 and PP1 represent feces from pregnant women in the control group and the probiotic group at the first sampling time, respectively; PC2 and PP2 represent feces from pregnant women in the control group and the probiotic group at the second sampling time CD1, CD3, CD14, and CM6 represent feces from infants in the control group at day 1, 3, 14, and month 6 after birth, respectively; PD1, PD3, PD14, and PM6 represent feces from infants in the probiotic group at day 1, 3, 14, and month 6 after birth, respectively.

