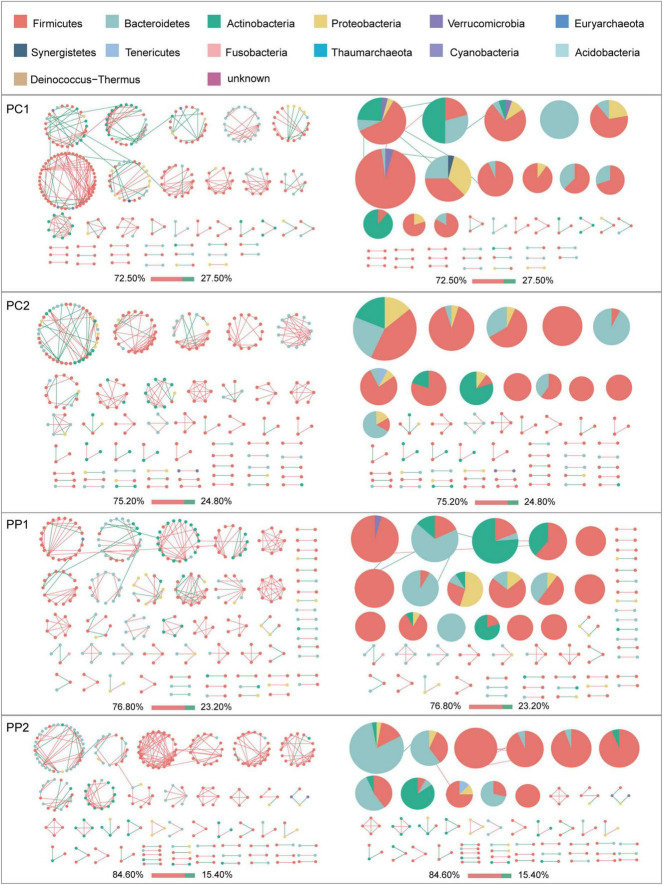
FIGURE 4.
Modules within gut microbial networks of pregnant women with or without probiotic supplementation. The colors of nodes represent different major phyla; pie charts exhibit the phylum level composition of modules with ≥ 5 nodes. Red edges indicate positive correlations between nodes, whereas green edges indicate negative correlations. The bar underneath each networks demonstrate the proportion of positive and negative correlations.

