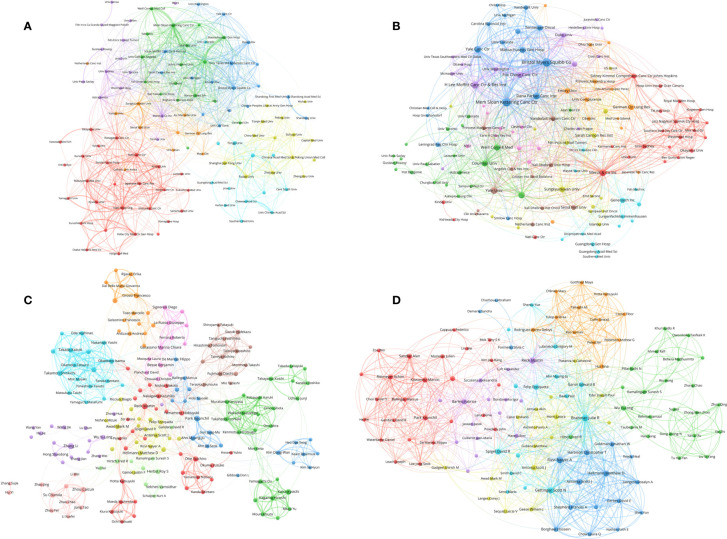
Figure 5.
(A) Network visualization of institutions with at least 15 papers related to lung cancer immunotherapy. (B) Network visualization of institutions with at least 2 top papers related to lung cancer immunotherapy. (C) Network visualization of authors with at least 10 papers related to lung cancer immunotherapy. (D) Network visualization of authors with at least 2 top papers related to lung cancer immunotherapy. The circle size represents the number of papers. The breadth of the curves represents the connection strength. The institutions in the same color have stronger collaboration with each other.

