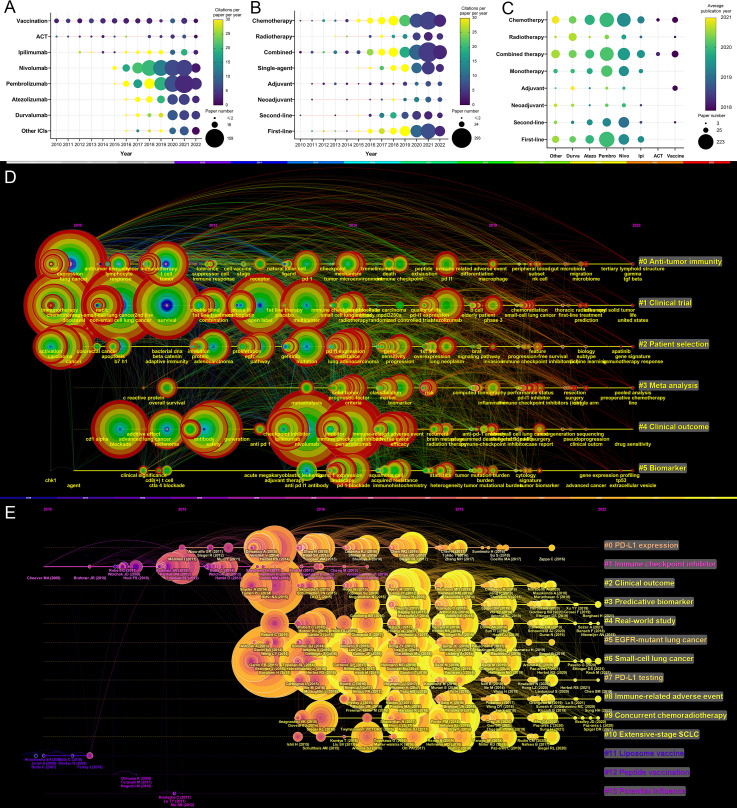
Figure 7.
(A) Publication number and citations per paper per year of different therapies/drugs. The node size represents the paper number and the color represents the average citations per paper. (B) Publication number and citations per paper per year of different treatments. The node size represents the paper number and the color represents the average citations per paper. (C) The publication number and average publication year of therapies/drugs for different treatments. The node size represents the paper number and the color represents the average publication year. (D) The timeline view for co-cited keywords related to lung cancer immunotherapy. The node size represents the citation number of the reference. The curves between the nodes indicated co-citation relationships. (E) The timeline view for co-cited references related to lung cancer immunotherapy. The node size represents the citation number of the reference. The curves between the nodes indicated co-citation relationships. Yellow nodes represent new papers and red nodes represent old ones.

