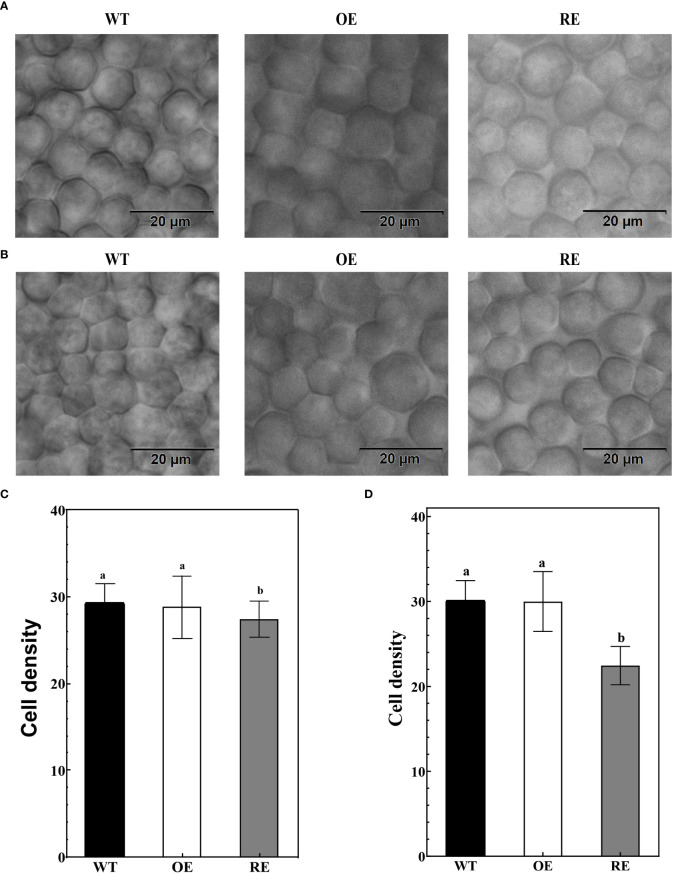
Figure 3.
Leaf palisade tissues of the RE, OE, and WT lines (A) Observation of the palisade tissue cells in the main vein area; (B) Leaf margin palisade tissue cell observation; (C) The number of cells per unit area of the palisade tissues in the main vein area; Error bars indicate SD, n = 70; (D) Number of cells per unit area of the leaf margin palisade tissues. Error bars indicate SD, n = 70. Different letters denote statistically significant differences after one-way ANOVA.

