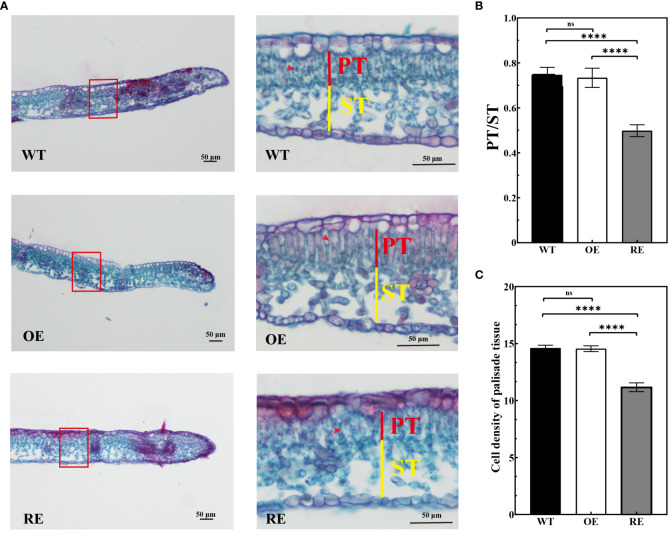
Figure 4.
Leaf margin section observation of the RE, OE, and WT lines (A) Leaf margin sections of RE, WT, and OE lines, Scale bar = 50 μm; (B) Marginal zone ratio of the test lines; (C) Cell density of palisade tissues under the transverse view of the leaf margin area. Error bars indicate SD, n = 30. Data were analyzed by one-way ANOVA. ****p< 0.0001 and ns, no significance.

