Figure 6.
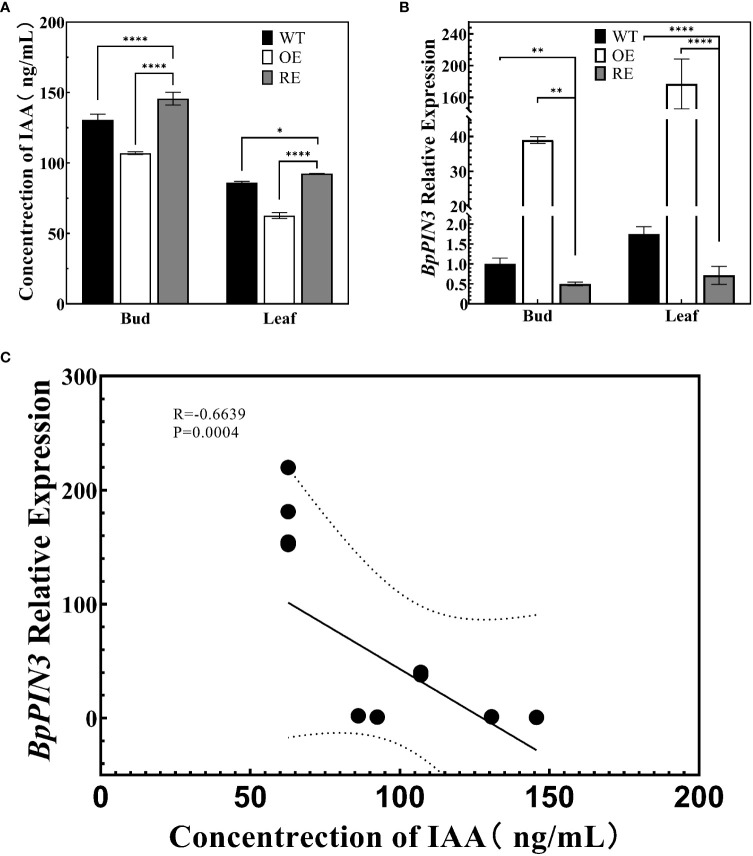
Auxin content and BpPIN3 expression in apical buds and leaves of the tested lines (A) Auxin content in the shoot apex and leaves of the RE, OE, and WT lines. (B) Relative expression of BpPIN3 in the shoot apex and leaves of the RE, OE, and WT lines. (C) Pearson’s correlation analysis of auxin and BpPIN3 expression. Data were analyzed by one-way ANOVA. Error bars indicate SD, n = 3. *p< 0.05; **p< 0.01; ****p< 0.0001.

