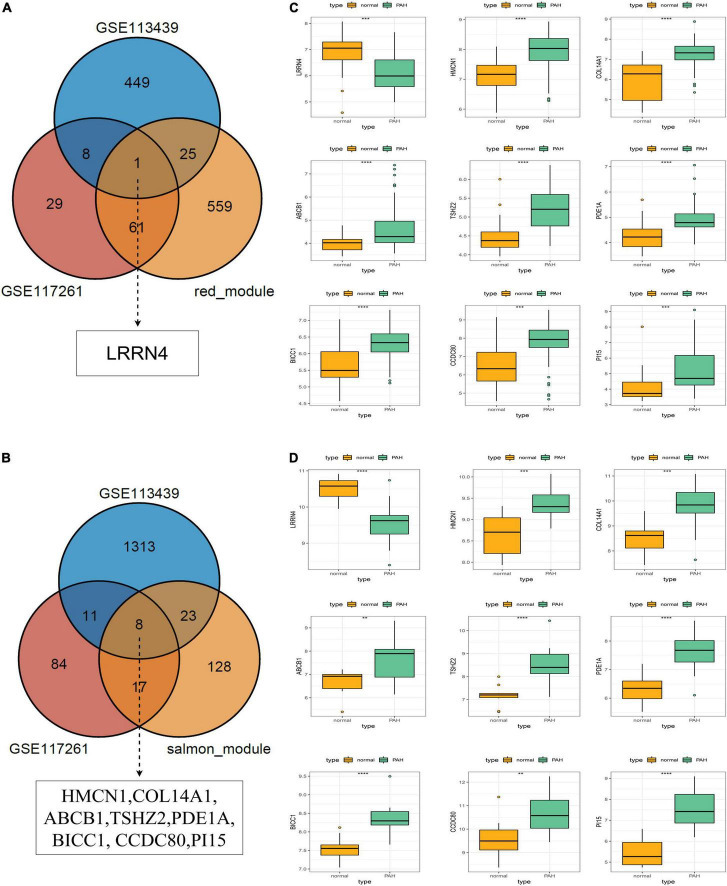
FIGURE 5.
Selection and validation of key regulatory genes. (A) Venn diagram to indicate one downregulatory gene from the red module and DEGs. (B) Venn diagram to indicate eight upregulatory genes from the salmon module and DEGs. (C) Validation of key regulatory genes in the dataset GSE117261. (D) Validation of key regulatory gene in the dataset GSE113439.

