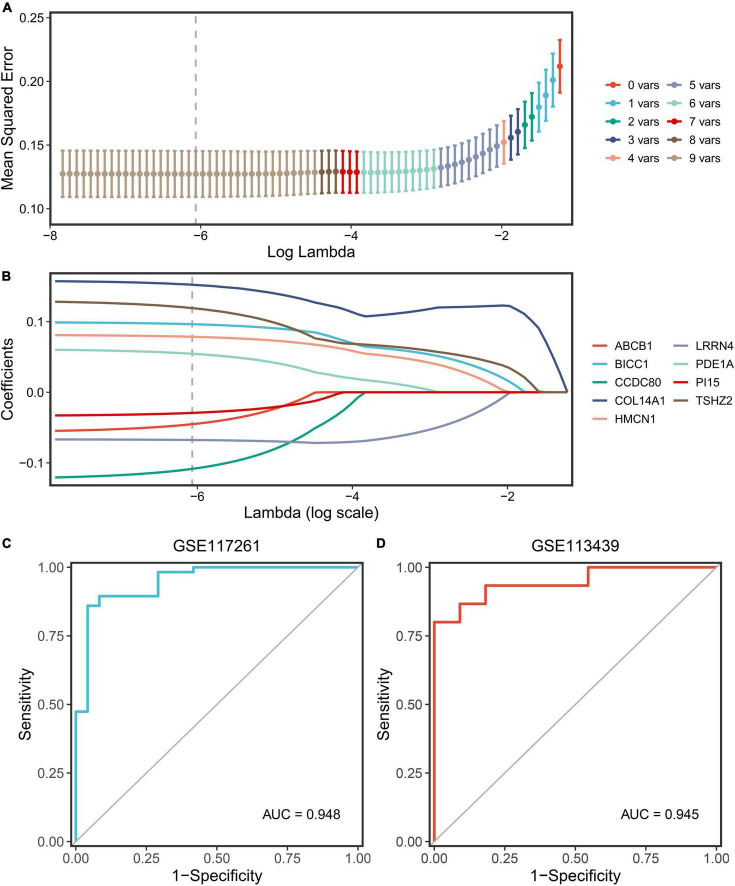
FIGURE 6.
Screening and validation of the genes. (A) Determination of the optimal lambda was obtained when the partial likelihood deviance reached the minimum value and further generated the key gene with non-zero coefficients. (B) LASSO coefficient profiles of the candidate gene for PDS construction. (C) The ROC curve of the modeling dataset (GSE117261). (D) The ROC curves of validation datasets (GSE113439).

