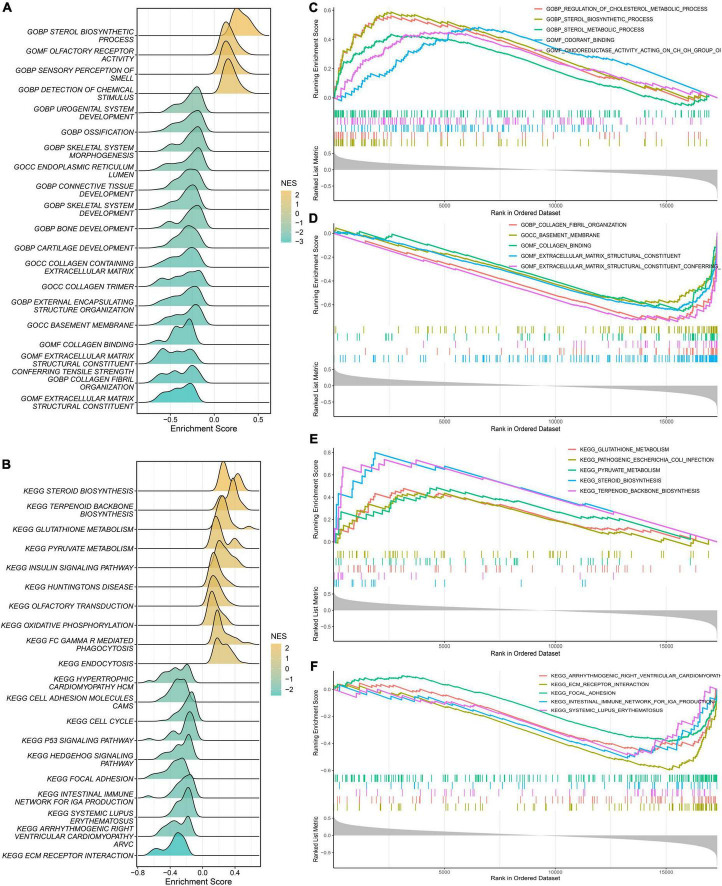
FIGURE 7.
Gene Set Enrichment Analysis (GSEA). (A) The ridge plot of the top 20 GO terms with ranked genes of the modeling dataset. (B) The ridge plot of the top 20 KEGG pathways with ranked genes of the modeling dataset. (C,D) The positive and negative top five GO terms with ranked genes of the modeling dataset. (E,F) The positive and negative top five KEGG pathways with ranked genes of the modeling dataset.

