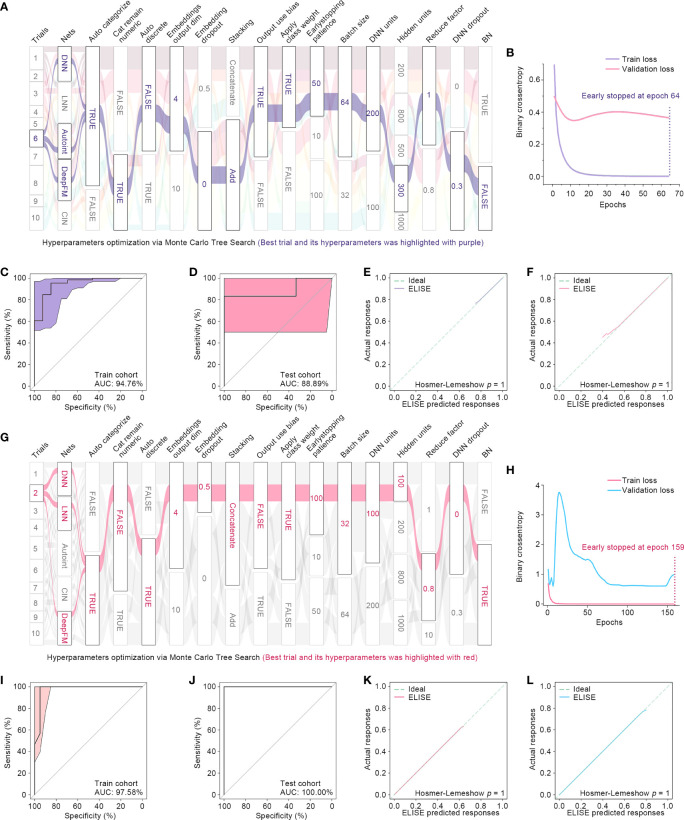
Figure 6.
ELISE applied in UCs and melanoma. (A) Hyperparameter optimization in UCs. (B) Loss function curves in UCs. (C, D) AUCs of ELISE applied in UCs in the train and test cohort. (E, F) are the calibration plots of ELISE in the train and test cohort, respectively. (G) Hyperparameter optimization in MELANOMAs. (H) Loss function curves in MELANOMAs. (I, J) AMELANOMAs of ELISE applied in MELANOMAs in the train and test cohort. (K, L) are the calibration plots of ELISE in the train and test cohort, respectively.

