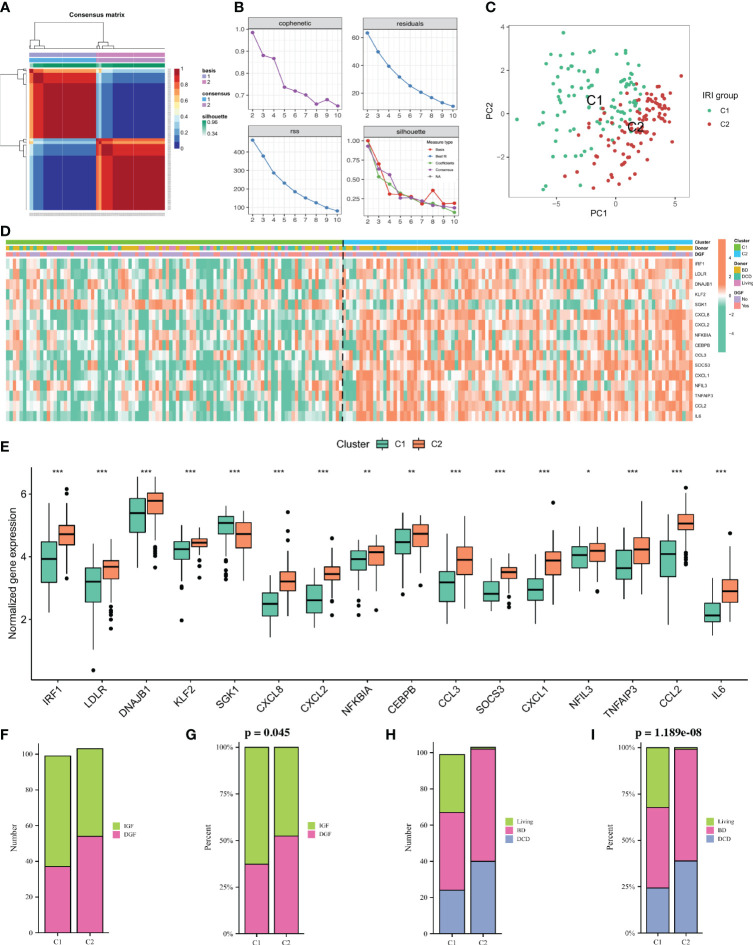
Figure 3.
Non-negative matrix factorization (NMF) analysis for the IRI samples. (A) Consensus map of NMF clustering when k = 2. (B) Distribution of cophenetic, residuals, RSS and silhouette with a rank of 2–10. (C) A PCA plot of the expression profile of DE-NRGs between two clusters. (D): Heatmap showing the expression landscape of DE-NRGs and the clinical characteristics of the two clusters. (E): Box plot showing the expression of 16 DE-NRGs between the two clusters. (F, G): Histogram comparing the differences in donor between the two clusters. (H, I) Histogram comparing the differences in the occurrence of DGF between the two clusters. IRI, ischemia reperfusion injury; RSS, residual sum of squares; PCA, principal component analysis; DE-NRGs, differentially expressed NET-related genes; DGF, delayed graft function. *P < 0.05, **P < 0.01, ***P < 0.001.

