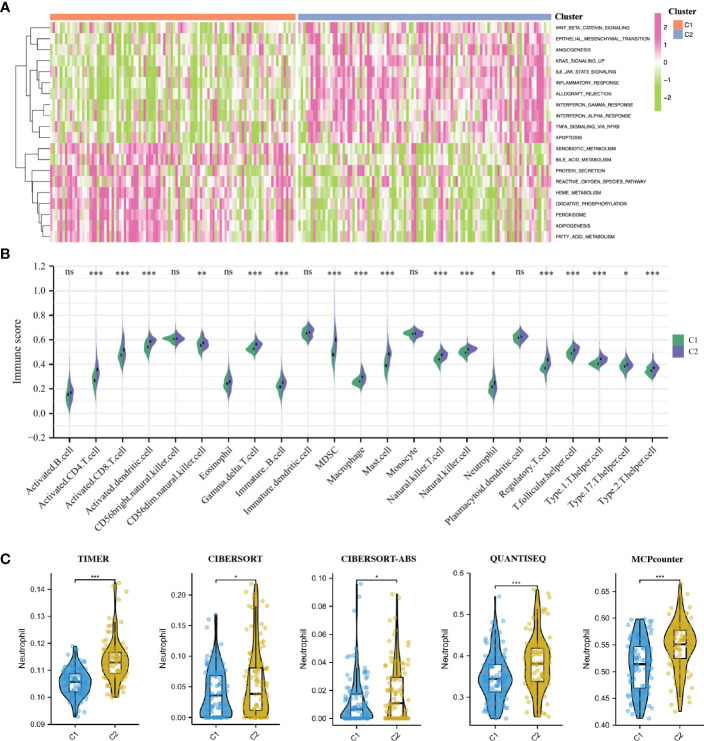
Figure 4.
GSVA enrichment analysis and immune infiltration analysis of IRI clusters. (A): The heatmap showing the different hallmarks between the two clusters. (B) Pod-plot showing the infiltration of 23 types of immune cells between the two clusters. (C) Comparison of the infiltration of neutrophils between clusters using other five algorithms. GSVA, gene set variation analysis. *P < 0.05, **P < 0.01, ***P < 0.001; ns, no significance.

