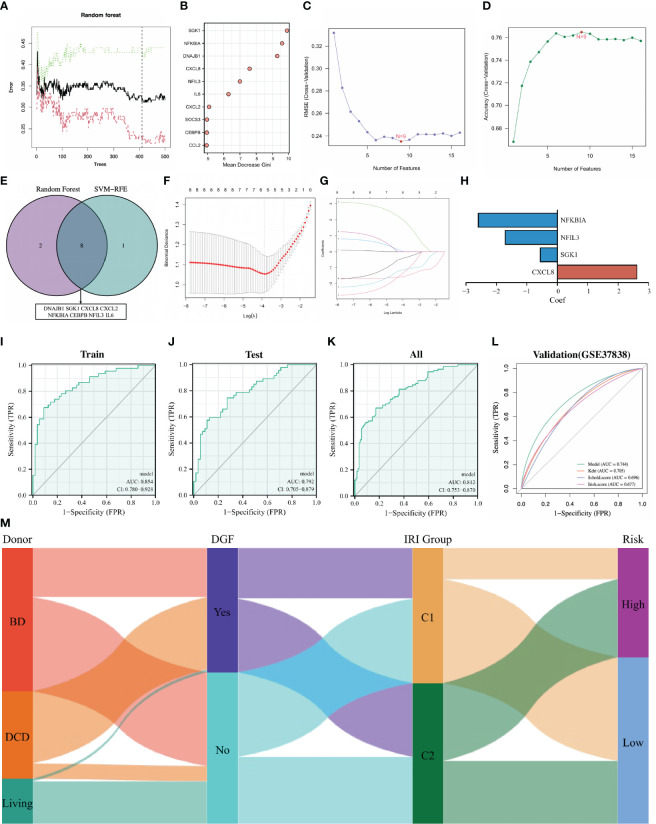
Figure 5.
Establishment and validation of the DGF predictive model. (A) Random forest tree. The abscissa represents trees and the ordinate represents the error rate. Red represents the DGF samples, green represents the non-DGF samples, and black represents the overall samples. The dotted line represents the tree holding the minimum error rate. (B): Gini importance measure. The horizontal axis represents mean decrease Gini, and the vertical axis represents characteristic NRGs. (C, D) Feature NRGs were selected with the SVM-RFE algorithm at the optimal point. (E): Intersecting the top 10 NRGs identified by the RF and the 9 NRGs screened by the SVM-RFE. (F, G): The 4 candidate NRGs obtained by LASSO regression with 10-fold cross-validation. (H): LASSO coefficients profiles of candidate NRGs in the model. (I–L): Evaluating the performance of the model in the training set, internal testing set, whole set and external validation set using ROC curves. (M): Sankey diagram showing the relationships among the type of donors, the occurrence of DGF, the IRI cluster and the risk of IRI samples. DGF, delayed graft function; NRGs, NET-related genes; SVM-RFE, support vector machine recursive feature elimination; RF, random forest; LASSO, least absolute shrinkage and selection operator; ROC, receiver operating characteristic; IRI, ischemia reperfusion injury.

