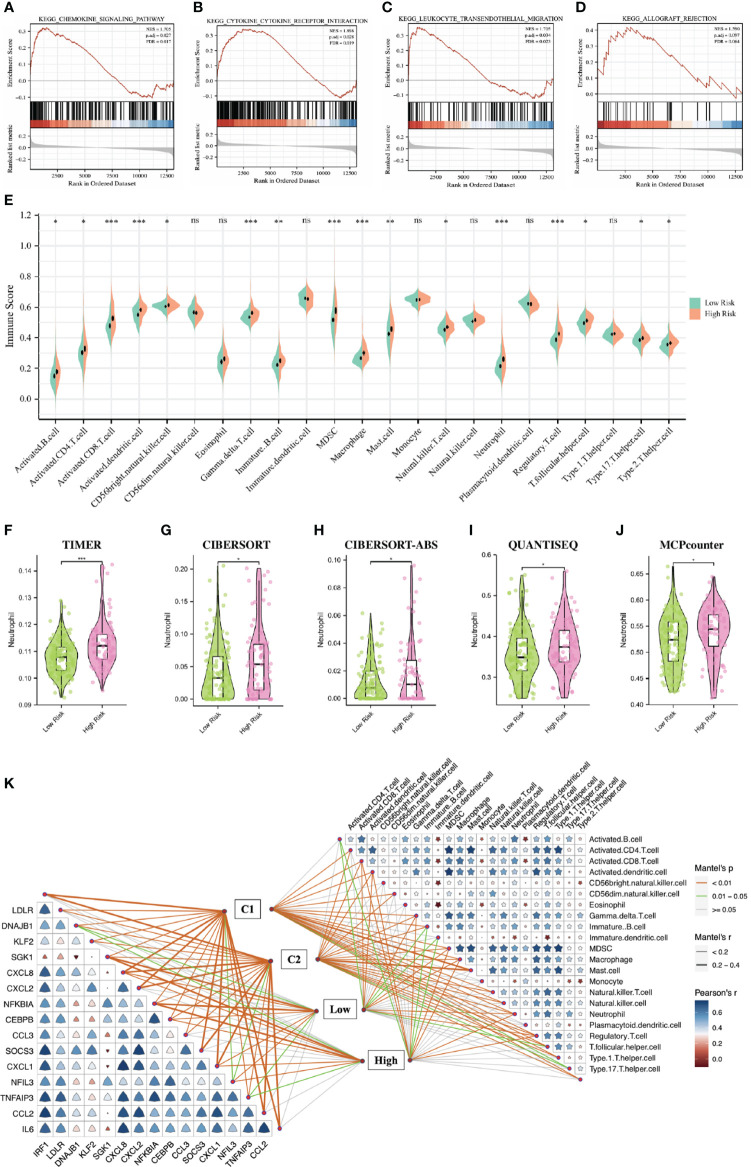
Figure 6.
Function enrichment analysis and immune infiltration analysis based on the DGF predictive model. (A–D): GSEA showing the different pathways between the two IRI groups. (E): Pod-plot showing the infiltration of 23 types of immune cells between the two groups. (F–J): Comparison of the infiltration of neutrophils between groups using other five algorithms. (K): the correlation between 23 immune-related cells, the correlation between 16 DE-NRGs and the relationships between immune-related cells, DE-NRGs and IRI subgroups classified by two strategies. DGF, delayed graft function; GSEA, gene set enrichment analysis; IRI, ischemia reperfusion injury; DE-NRGs, differentially expressed NET-related genes. *P < 0.05, **P < 0.01, ***P < 0.001; ns, no significance.

