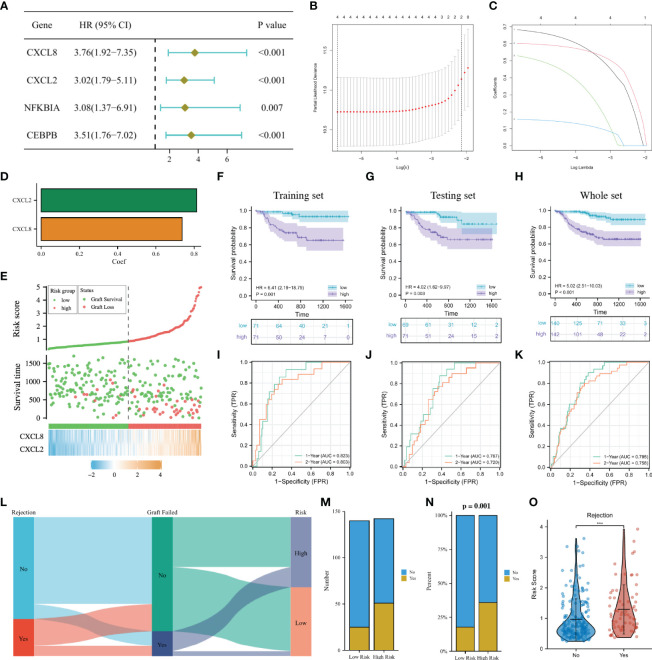
Figure 7.
Construction of a predictive signature for the long-term survival. (A): Forrest plot of univariable Cox regression analysis. (B, C): The 2 candidate NRGs obtained by LASSO regression with 10-fold cross-validation. (D): LASSO coefficients profiles of candidate NRGs in the signature. (E): Risk map of the two risk groups. (F–H): K-M survival analysis of the model in the training set, the testing set and the whole set. (I–K): Time-dependent ROC analysis in the training set, the testing set and the whole set. (L): Sankey diagram showing the relationship among the occurrence of AR, long-term graft failure and the risk of recipients. (M, N): Histogram comparing the differences in the occurrence of AR between the two groups. (O): Comparison of the risk score between AR and non-AR recipients. NRGs, NET-related genes; LASSO, least absolute shrinkage and selection operator; K-M, Kaplan–Meier; ROC, receiver operating characteristic; AR, acute rejection.

