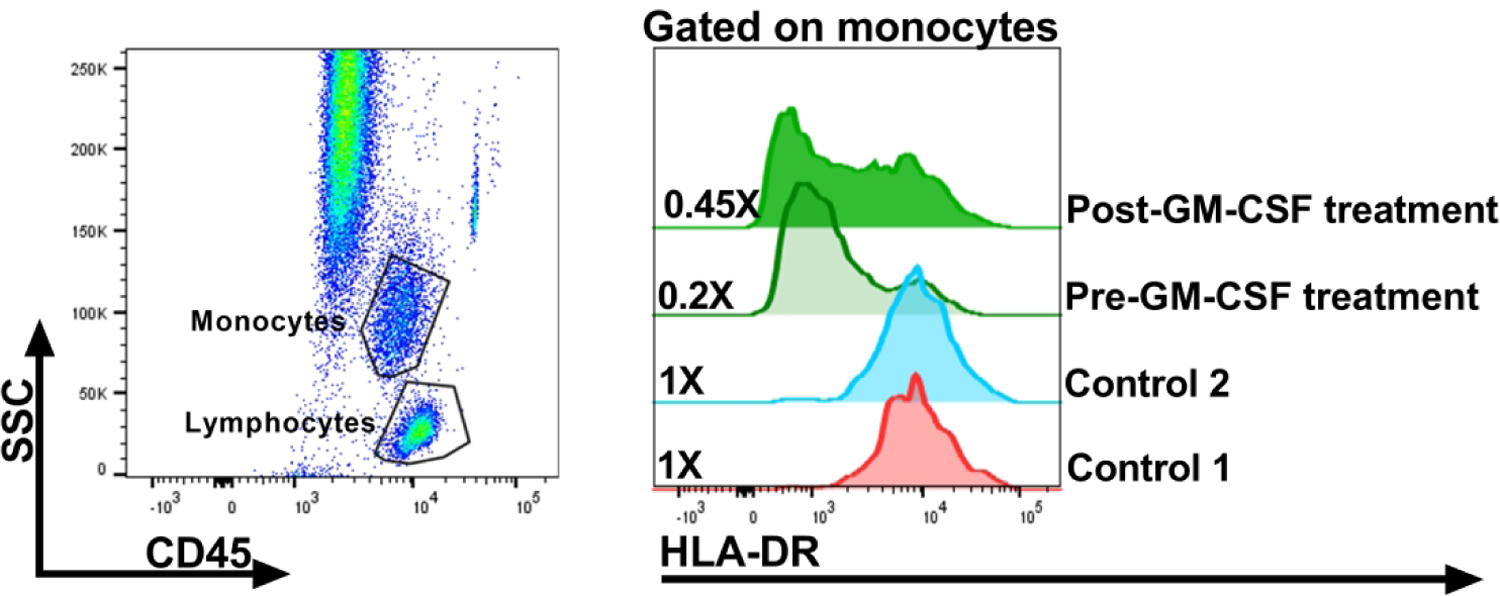
Figure 2: Representative monocyte HLA-DR expression before and after GM-CSF treatment in sepsis.

This is an example of polychromatic flow-cytometry utilized to assess monocyte-associated HLA-DR expression pre and post GM-CSF treatment in a sepsis patient. Briefly, whole blood samples from a patient and commercially available flow-cytometry control samples (Streck, Omaha, NE) were stained with fluorochrome-conjugated monoclonal antibodies targeting the CD45, CD3 and HLA-DR surface markers, and hierarchical gating was utilized to evaluate HLA-DR expression on monocytes. Monocytes were identified based on CD45 expression and light scatter characteristics (side-scatter [SSC]) (left panel). Surface expression of HLA-DR on monocytes is demonstrated by utilizing the stacked histogram plot (right panel). The numerical values in the plot depict the frequency of monocytes expressing HLA-DR and response post GM-CSF therapy. Laboratory assays done under IRB-approved protocol at Lurie Children’s.
