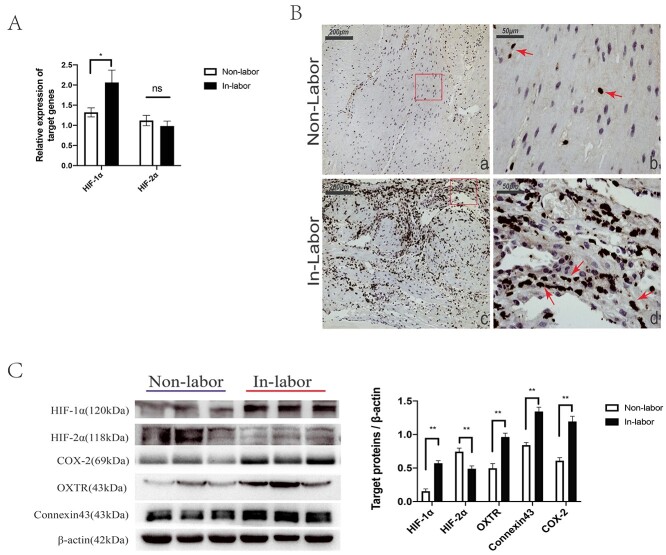
Figure 1.
Comparison of the expression levels of mRNA and protein detected in myometrium between groups. (A) Q-PCR analysis of mRNA levels of HIF-1α (Hif1a) and HIF-2α (Endothelial PAS Domain Protein 1, Esap1) (10 nonlaboring vs. 10 laboring samples). (B) Western blot analysis of indicated protein expression (10 nonlaboring vs. 10 laboring samples). (C) Detection of HIF-1α in myometrium sections was visualized by immunohistochemistry. The HIF-1α (+) staining signal was shown in the nuclei, pointed out with arrows. Images (a) and (c) represent nonlaboring and laboring myometrium, respectively; scale bar: 200 μm. Images (b) and (d) are the enlarged view of image (a) and (c), respectively; scale bar: 50 μm. Compared to nonlabor, *P < 0.05, **P < 0.01, ns for no significance.

