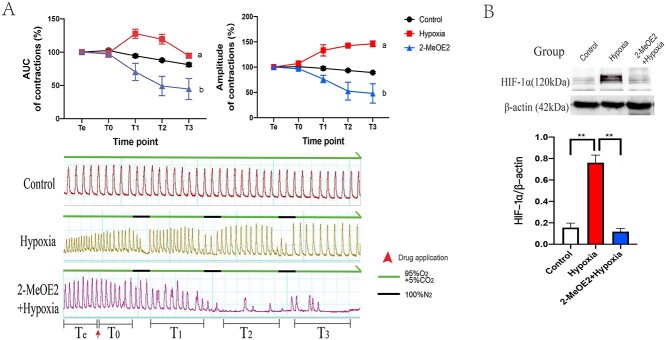
Figure 2.
Isometric tension measurement of uterine strips in vitro (n = 6). The process was divided into five periods: (1) Te for observing spontaneous contraction and baseline setting; (2) T0 for the period after reagents added; (3) T1, T2, and T3 representing periods of contractile changes following corresponding hypoxic treatment. (A) Changes of AUC and amplitude among the group from Te to T3 and the information of waves and experiment settings. During the normoxic period, the chambers were bubbled with mixed gas (95% O2 + 5% CO2), whereas 100% N2 was bubbling for 15 mins into the chambers to create hypoxic condition. (a) Compared group hypoxia to control, the AUC in T1 (P < 0.05) and T2 (P < 0.01) was significantly higher, and the amplitude in group hypoxia gradually improved from T1 to T3 (P < 0.01). (b) Compared group hypoxia to control, both the AUC and amplitude were dramatically reduced following each hypoxic treatment, especially in T2 (P < 0.01) and T3 (P < 0.01). (B) Expression of HIF-1α in isolated uterine strips from groups. **P < 0.01.

