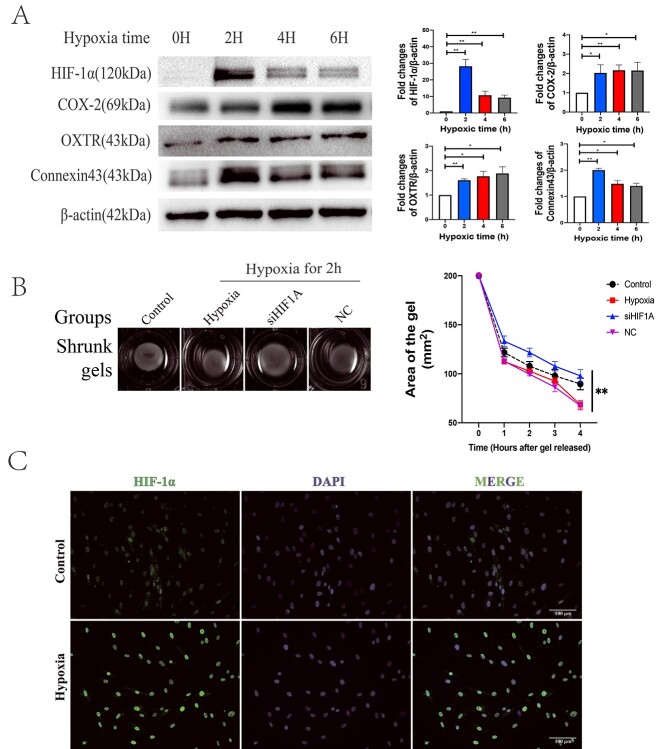
Figure 3.
Evaluation of hypoxia hMSMCs model. (A) Western blot analysis of indicated protein expression under 3% O2 for different time (h) (n = 3). (B) The shrunk gels of different groups in hMSMCs-gel contraction assay (n = 3). Images of gel area were captured from the first hour to the fourth hour after gels released; group control was treated under normoxia; group hypoxia, siHIF1A, and NC (negative control for siHIF1A) were treated with hypoxia for 2 h before released. (C) Location of HIF-1α in hMSMCs was visualized by immunoflourescence. Scale bar: 100 μm. *P < 0.05, **P < 0.01.

