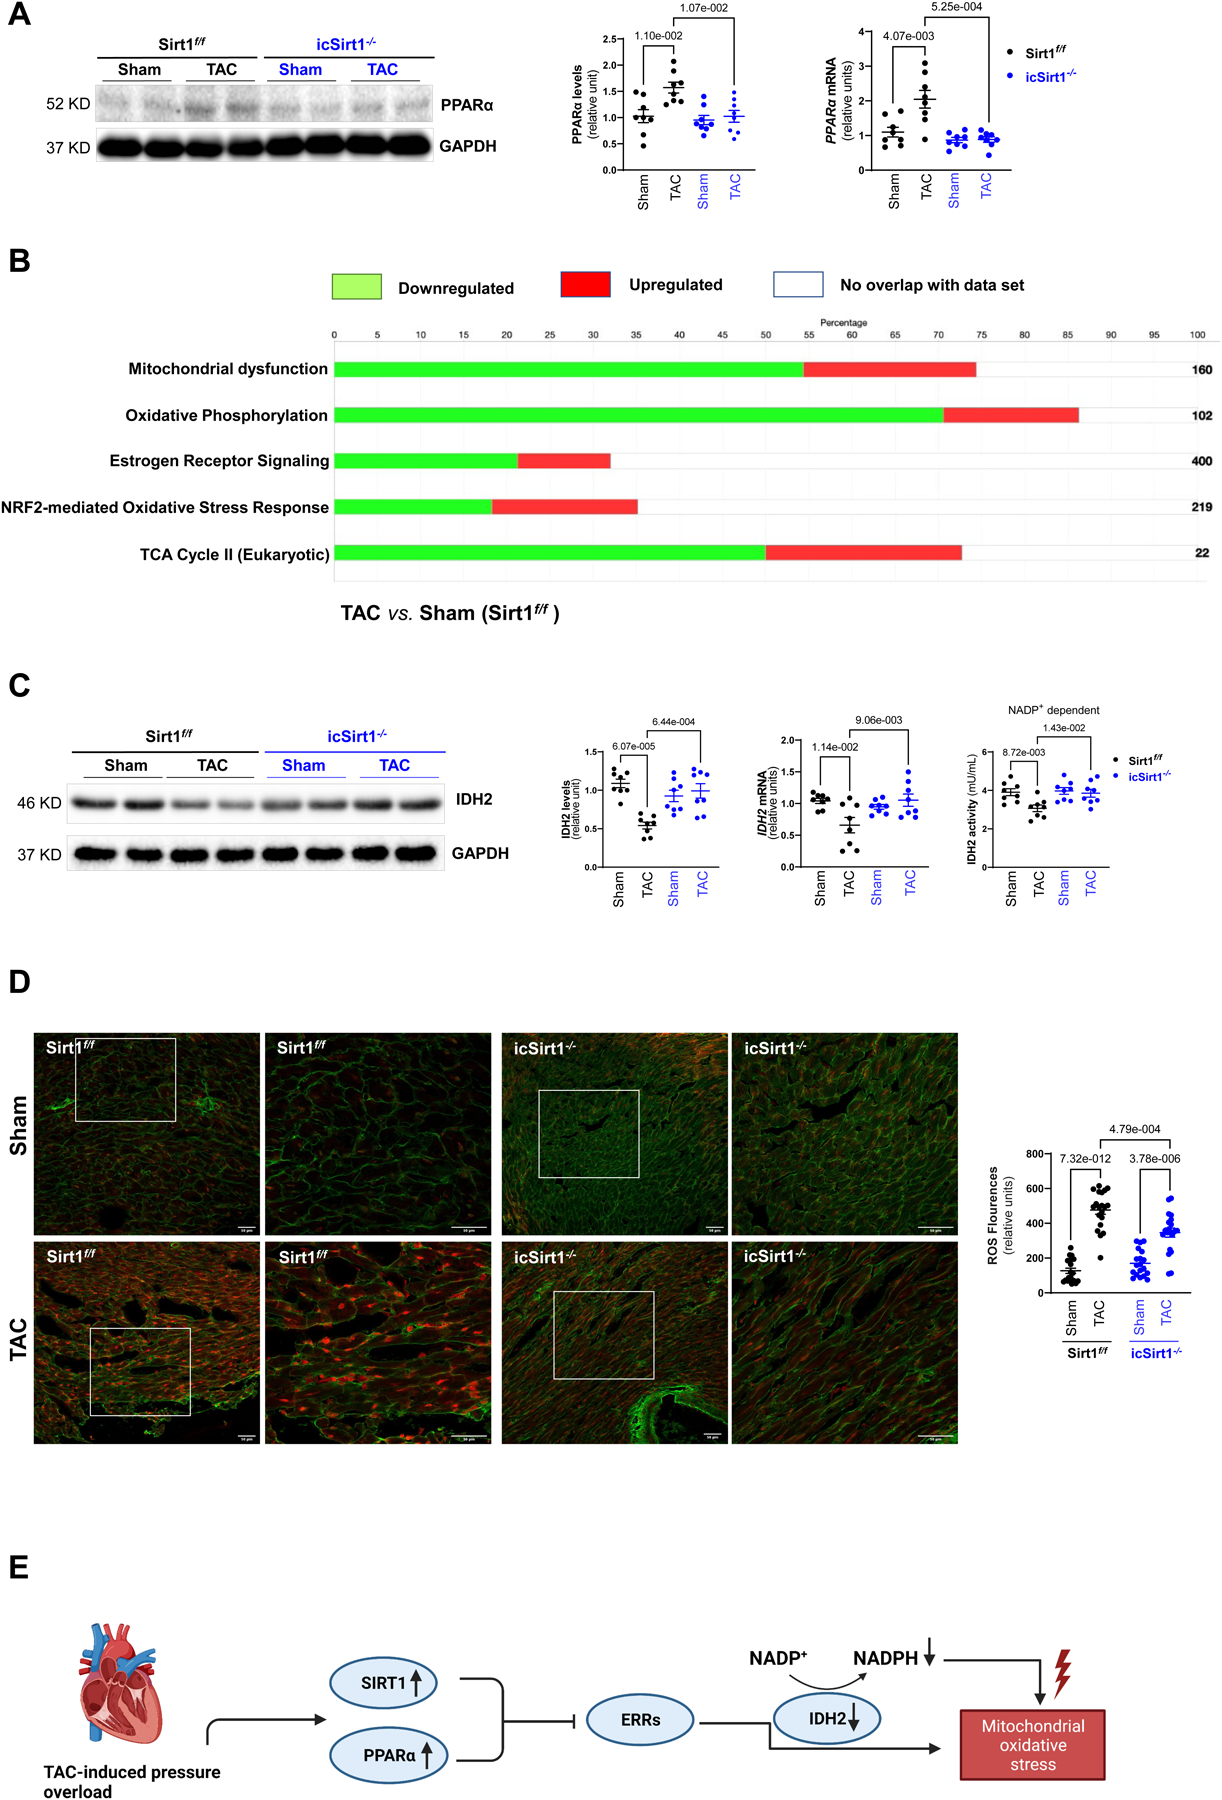
Figure 3. SIRT1 plays a role in mitochondrial oxdative phosphorylation in response to TAC-induced pressure overload.

(A) TAC-induced pressure overload stress increased protein and mRNA expression levels of PPARα in Sirt1f/f mice. Biological replicates N=8 for each group. P value was determined by two-way ANOVA with Tukey’s post-hoc test. (B) Ingenuity pathway analysis (IPA) enrichment analysis of targeted proteomics of Sirt1f/f heart with 6 weeks of post TAC versus sham group. Green bars representing the percentage of genes in the pathway were downregulated in Sirt1f/f 6 weeks of post TAC versus Sham. Red bars representing the percentage of genes in the pathway were upregulated in Sirt1f/f 6 weeks of post TAC versus Sham. White bars representing the percentage of genes in the pathway were not altered in Sirt1f/f 6 weeks of post TAC versus Sham. Biological replicates N=3 for each group. (C) Reduction of the IDH2 protein, mRNA expression levels, and NADP+ dependent activity in Sirt1f/f but not in icSirt1−/− heart in response to 6 weeks of TAC-induced stress. Biological replicates N=8 for each group. P value was determined by two-way ANOVA with Tukey’s post-hoc test. (D) MitoSOX™ staining showed a substantial increase in superoxide accumulation in the heart of Sirt1f/f after 6 weeks of TAC. Left: Representative microscopy images of reactive oxygen species staining. The scale bars are 50 μm. Right: Quantification analysis of MitoSOX™ staining. Biological replicates N=5 for each group. P value was determined by two-way ANOVA with Tukey’s post-hoc test. (E) Schematic representations of the regulatory roles of SIRT1 and PPARα in mitochondrial oxidative stress during TAC-induced pathological conditions.
