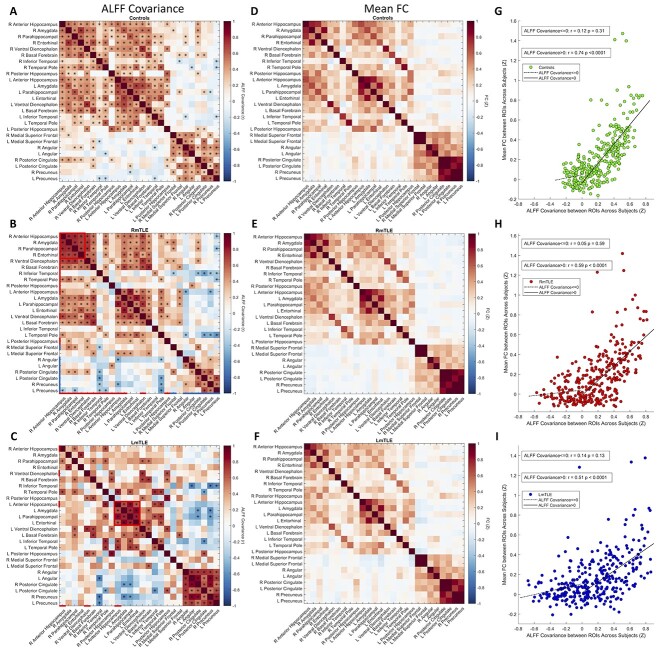
Fig. 2.
Regional fMRI activity covariance across subjects and association with FC. a–c) Regionwise ALFF covariance matrices across subjects in 26 identified regions for controls (n = 96), RmTLE patients (n = 32), and LmTLE patients (n = 15), respectively, calculated by Pearson correlation (*punc < 0.05). Regions with ALFF increases are denoted with red lines and regions with ALFF decreases are denoted with blue lines on left and bottom edges of ALFF covariance matrices. Red boxes highlight a small core of ipsilateral mesial temporal regions with positive ALFF covariance in both RmTLE and LmTLE patients. (d–f) Mean FC matrices in the 26 regions across each group for controls, RmTLE patients, and LmTLE patients. (g–i) Scatter plots of ALFF correlations between regions and mean FC between regions across subjects for all pairs of the 26 regions for controls, RmTLE patients, and LmTLE patients, with each point representing a single edge. Spearman correlations are shown on each plot between mean FC and ALFF covariance for ALFF covariance > 0 and ALFF covariance ≤ 0 separately. There is a strong association between the ALFF correlation and mean FC in pairs of nodes with a positive ALFF covariance for all 3 groups (spearman correlation, P < 0.0001, permutation test). R: right; L: left.

