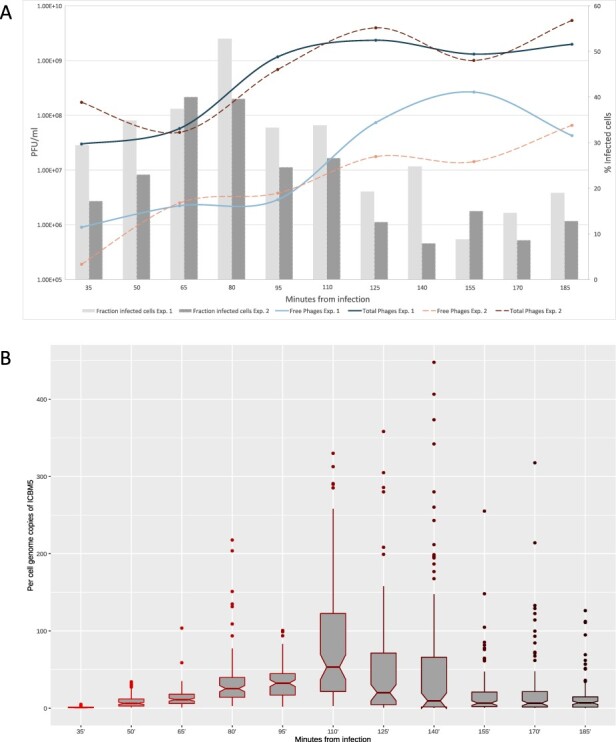
Figure 2.

ICBM5—S. dubius SH24-1b infection dynamics. A. The fraction of ICBM5-infected cells (bars) and the abundance of free (extracellular) and total (intra- and extracellular) phages, given in PFU/ml (lines). The fraction of infected cells was calculated from the proportion of cells showing a phage signal, after subtraction of the false-positive signals detected in the negative control cultures. B. The variation of the per-cell ICBM5 genome copies through the infection, as calculated from measuring the phage signal intensities using direct-geneFISH. The box plot borders represent the first and third quartiles, and the middle line represents the second quartile. The whiskers extend from the first or third quartiles with 1.5 × IQR (distance between the first and third quartiles). The data beyond the whiskers are plotted individually. The plot was generated using the ggplot2 R package (Hadley 2016). The different shades of red for the box plots are just indicating the progress of the infection time, from bright red at the beginning of the experiment, to dark red at the end of the experiment.
