Fig. 5.
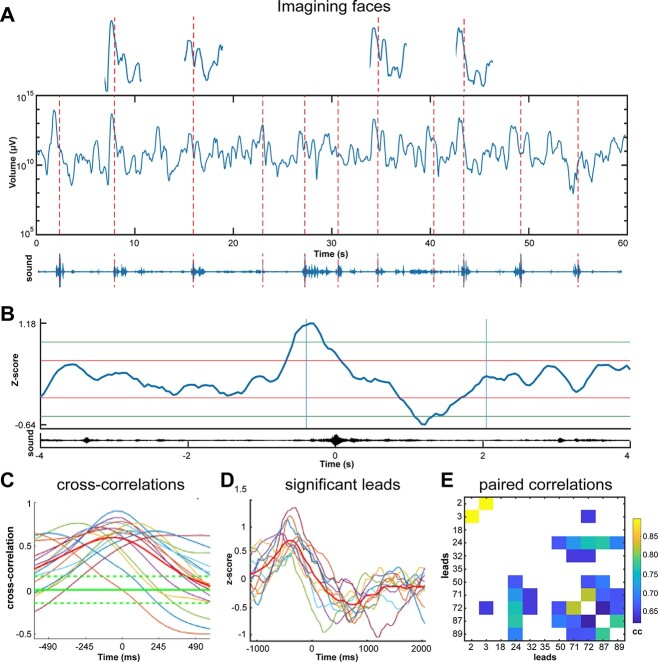
Single trial expansion and contraction. A) Fluctuations of V (V in equation (4)) in log10 scale, in 11 trials of recall of faces (memory retrieval test 1). Patient 17, lead 50, cortex in posterior part of the superior temporal sulcus. Above: 4 trials enlarged; below: Soundtrack with peaks indicated by the red stippled lines for each of the names of the 11 well-known persons to imagine (Methods). B) Z-score average of single trial volume changes; 4 s average of 11 z-scores showing one expansion and contraction. Average of the soundtrack below. Each trial was aligned to the peak amplitude of the sound. Vertical blue lines: The epoch displayed in C. horizontal red and green lines: 1 and 2 SD. The statistics determining significance was the pairwise cross-correlation between leads. C) Statistically significant cross-correlations of average z-scores between leads engaged in the task. Green stippled lines: 95% confidence limits. D) z-score averages of the volume expansions and contractions of the significant leads in C, with mean in red, note the different lags. E) Pairwise cross-correlations (cc) values of the leads in D.

