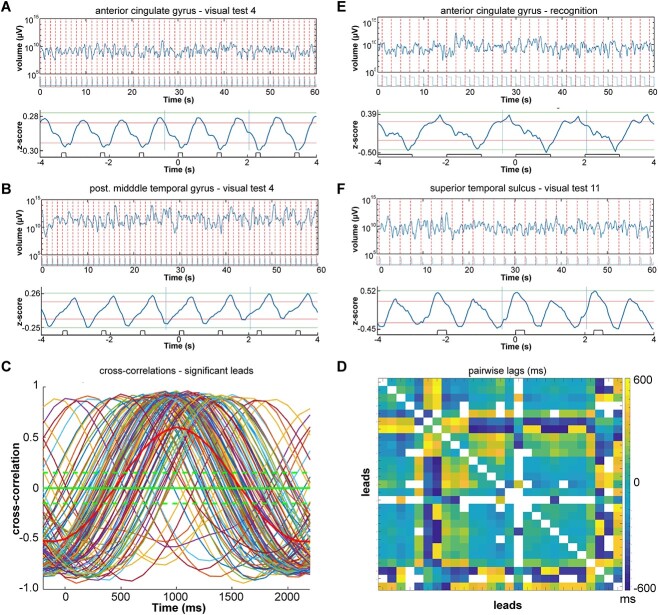
Fig. 6.
Entrainment of the expansions and contractions. A) 60 s epoch of fluctuating size of V (equation (4)) in log10 scale with onset of trials marked with red stippled lines. Bottom: average z-scores of volume fluctuations over trials with average stimulus presentation. Natural pictures presented 125 ms with 1-s black screen intermissions. Patient 11 lead 2, anterior part of cingulate gyrus. B) Same patient, same test, but lead 101; phase shift of the fluctuating expansions-contractions (compared with A). C) Pairwise significant cross-correlations of average z-scores above 70% quantile during the task for the time segment defined by the 2 vertical lines in A bottom. Green stippled lines: 95% confidence limits. Thick red curve: mean values. D) Matrix of the pairwise lags for all leads in C. E) Visual recognition test, patient 6, lead 2. Average of z-scores (top), 60 s episode of recognition of fluctuating size V in log10 scale with photodiode signal of picture presentation below. F) Fluctuating volume entrainment of double frequency. Geometrical pictures (visual test 11) patient 5, lead 25, cortex lining posterior part of superior temporal sulcus.

