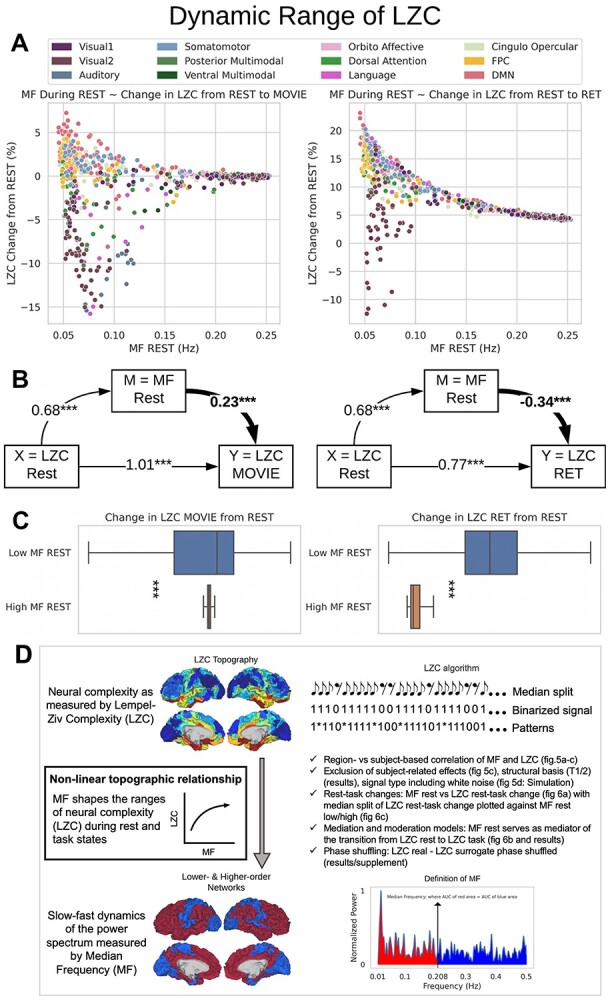
Fig. 6.

The relationship between MF during REST and the change in LZC from REST to TASK. A) The scatter plot of MF-REST (x-axis) versus the change in LZC (y-axis) from REST to MOVIE (left) and RET (right). The plots indicate a decrease in the range of the “change” as a function of MF-REST. B) Mediation model to investigate the role of MF-REST in the change in LZC from resting to task state. LZC-REST is used as the independent variable and the model investigates whether the effect of LZC-REST on LZC-MOVIE (left) or LZC-RET (right) as the dependent variable is mediated by MF-REST. The bootstrapped model showed significant partial mediation through MF-REST. C) Box plots showing the range of the “change” values for low-MF and high-MF during REST. MF-REST was median-split into low and high categories. Statistics were conducted using Student’s t-test over subjects. For each subject, a range of LZC change was calculated in low and high MF categories. For both conditions (MOVIE and RET), the range of LZC change in low-MF is significantly wider than high-MF. Stars represent the significance level  . D) Nonlinear topographic relationship of slow–fast dynamics and neural complexity.
