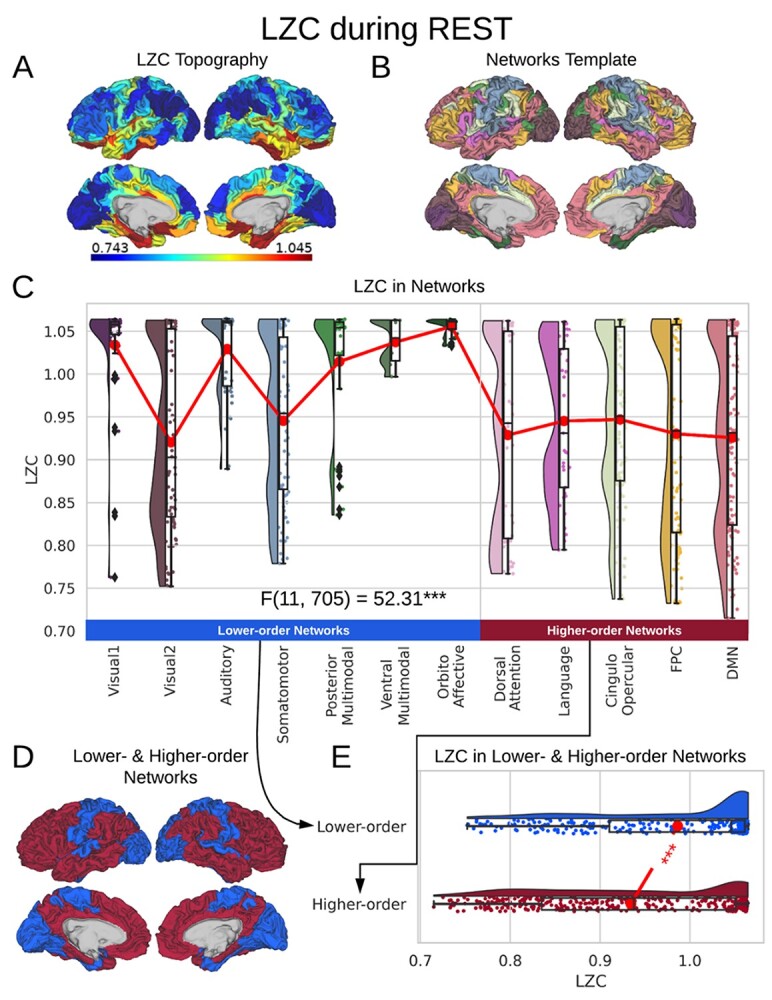
Fig. 2.

LZC during the resting state. Rainclouds represent regions. A) Spatial distribution of LZC during REST condition. LZC is calculated for a region after binarizing its blood oxygenation level-dependent (BOLD) signal’s amplitude using the median as a threshold. B) Brain map of the 12 networks defined in the study of Ji et al. (2019). Colors represent different networks. C) Distribution of LZC values in different networks. Colors are the same as in B. Higher-order networks show lower LZC compared to lower-order ones. One-way ANOVA showed a significant  difference among all networks
  . D) Brain map representing lower- and higher-order categories. E) LZC during resting state along the lower- and higher-order categories. The Student’s t-test shows lower-order regions have significantly higher LZC compared to higher-order ones
  . Stars represent the significance level
