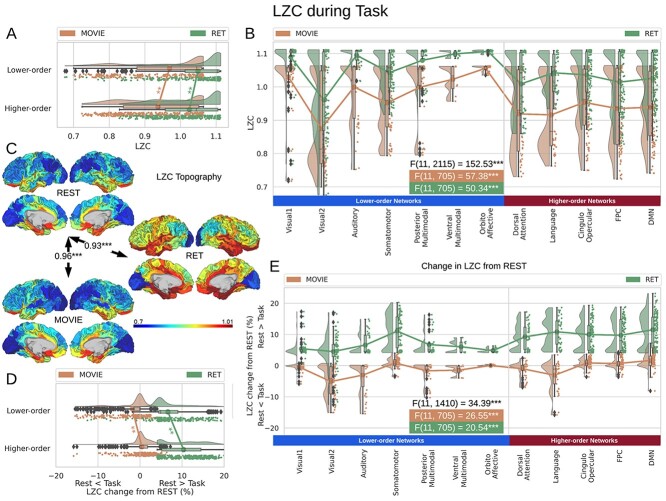
Fig. 3.
LZC during the task states. Points in the rain plots represent regions. A) LZC during MOVIE and RET for lower- and higher-order networks. The paired Student’s t-test between lower- and higher-order networks is significant with  for MOVIE and
  for RET. B) LZC during the 2-task conditions for the 12 networks. Three separate ANOVA models (1 over the whole data, 1 for only the MOVIE, and 1 for only the RET data) showed significant differences among the networks. C) Spatial distribution of LZC during REST, MOVIE, and RET conditions alongside their corrected spatial correlation coefficients. The correlation is calculated over the regions to show the spatial similarity between resting and task states. D) Change in LZC from REST to both task conditions for lower- and higher-order networks. Similar to task state results, the change was also significantly different between the 2 categories. E) Change in LZC from REST to MOVIE and RET is also significantly different among the 12 networks. Stars represent the significance level
  .
.

