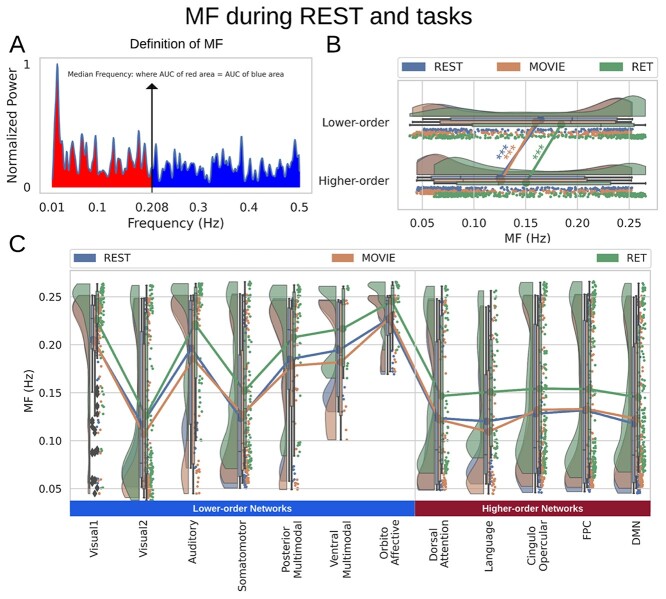
Fig. 4.
MF during both resting and task states. Points in the rain clouds represent regions. Stars represent the significance level  . A) A power spectrum of a sample signal. MF is calculated as the frequency at which the AUC of power up to that frequency (red area) is equal to AUC beyond that point (blue area). B) Similar to LZC, MF is significantly higher in lower-order networks compared to higher-order ones. C) MF is also significantly different among the 12 networks during both resting and task states.

